
3.1 The 2045 LRTP and Model
The 2045 Long-Range Transportation Plan (LRTP) was adopted by the PPACG Board of Directors in January 2020. As the plan in effect on January 30, 2022, it serves as the baseline against which future GHG reductions are measured. Like most regional transportation plans, it contains a forecast of land use and population changes, along with a variety of fiscally constrained projects designed to address the region’s transportation needs.
The 2045 LRTP’s land use forecast was developed from population and workforce estimates provided by the state demographer’s office, which served as regional control totals.
Figure 4: Population and employment forecasts from the 2045 LRTP
| Region | 2015 | 2020 | 2025 | 2030 | 2035 | 2040 | 2045 |
|---|---|---|---|---|---|---|---|
| Population | 701,483 | 758,232 | 819,138 | 880,361 | 940,711 | 1,001,120 | 1,055,656 |
| Employment | 364,561 | 401,735 | 434,104 | 468,176 | 495,948 | 518,862 | 541,984 |
| El Paso County | 2015 | 2020 | 2025 | 2030 | 2035 | 2040 | 2045 |
|---|---|---|---|---|---|---|---|
| Population | 677,022 | 732,993 | 791,904 | 851,955 | 911,825 | 970,825 | 1,024,521 |
| Employment | 354,681 | 390,309 | 421,464 | 454,501 | 481,509 | 503,824 | 526,450 |
| Teller County | 2015 | 2020 | 2025 | 2030 | 2035 | 2040 | 2045 |
|---|---|---|---|---|---|---|---|
| Population | 24,461 | 25,239 | 27,234 | 28,406 | 29,421 | 30,295 | 31,135 |
| Employment | 9,880 | 11,426 | 12,640 | 13,675 | 14,439 | 15,038 | 15,534 |
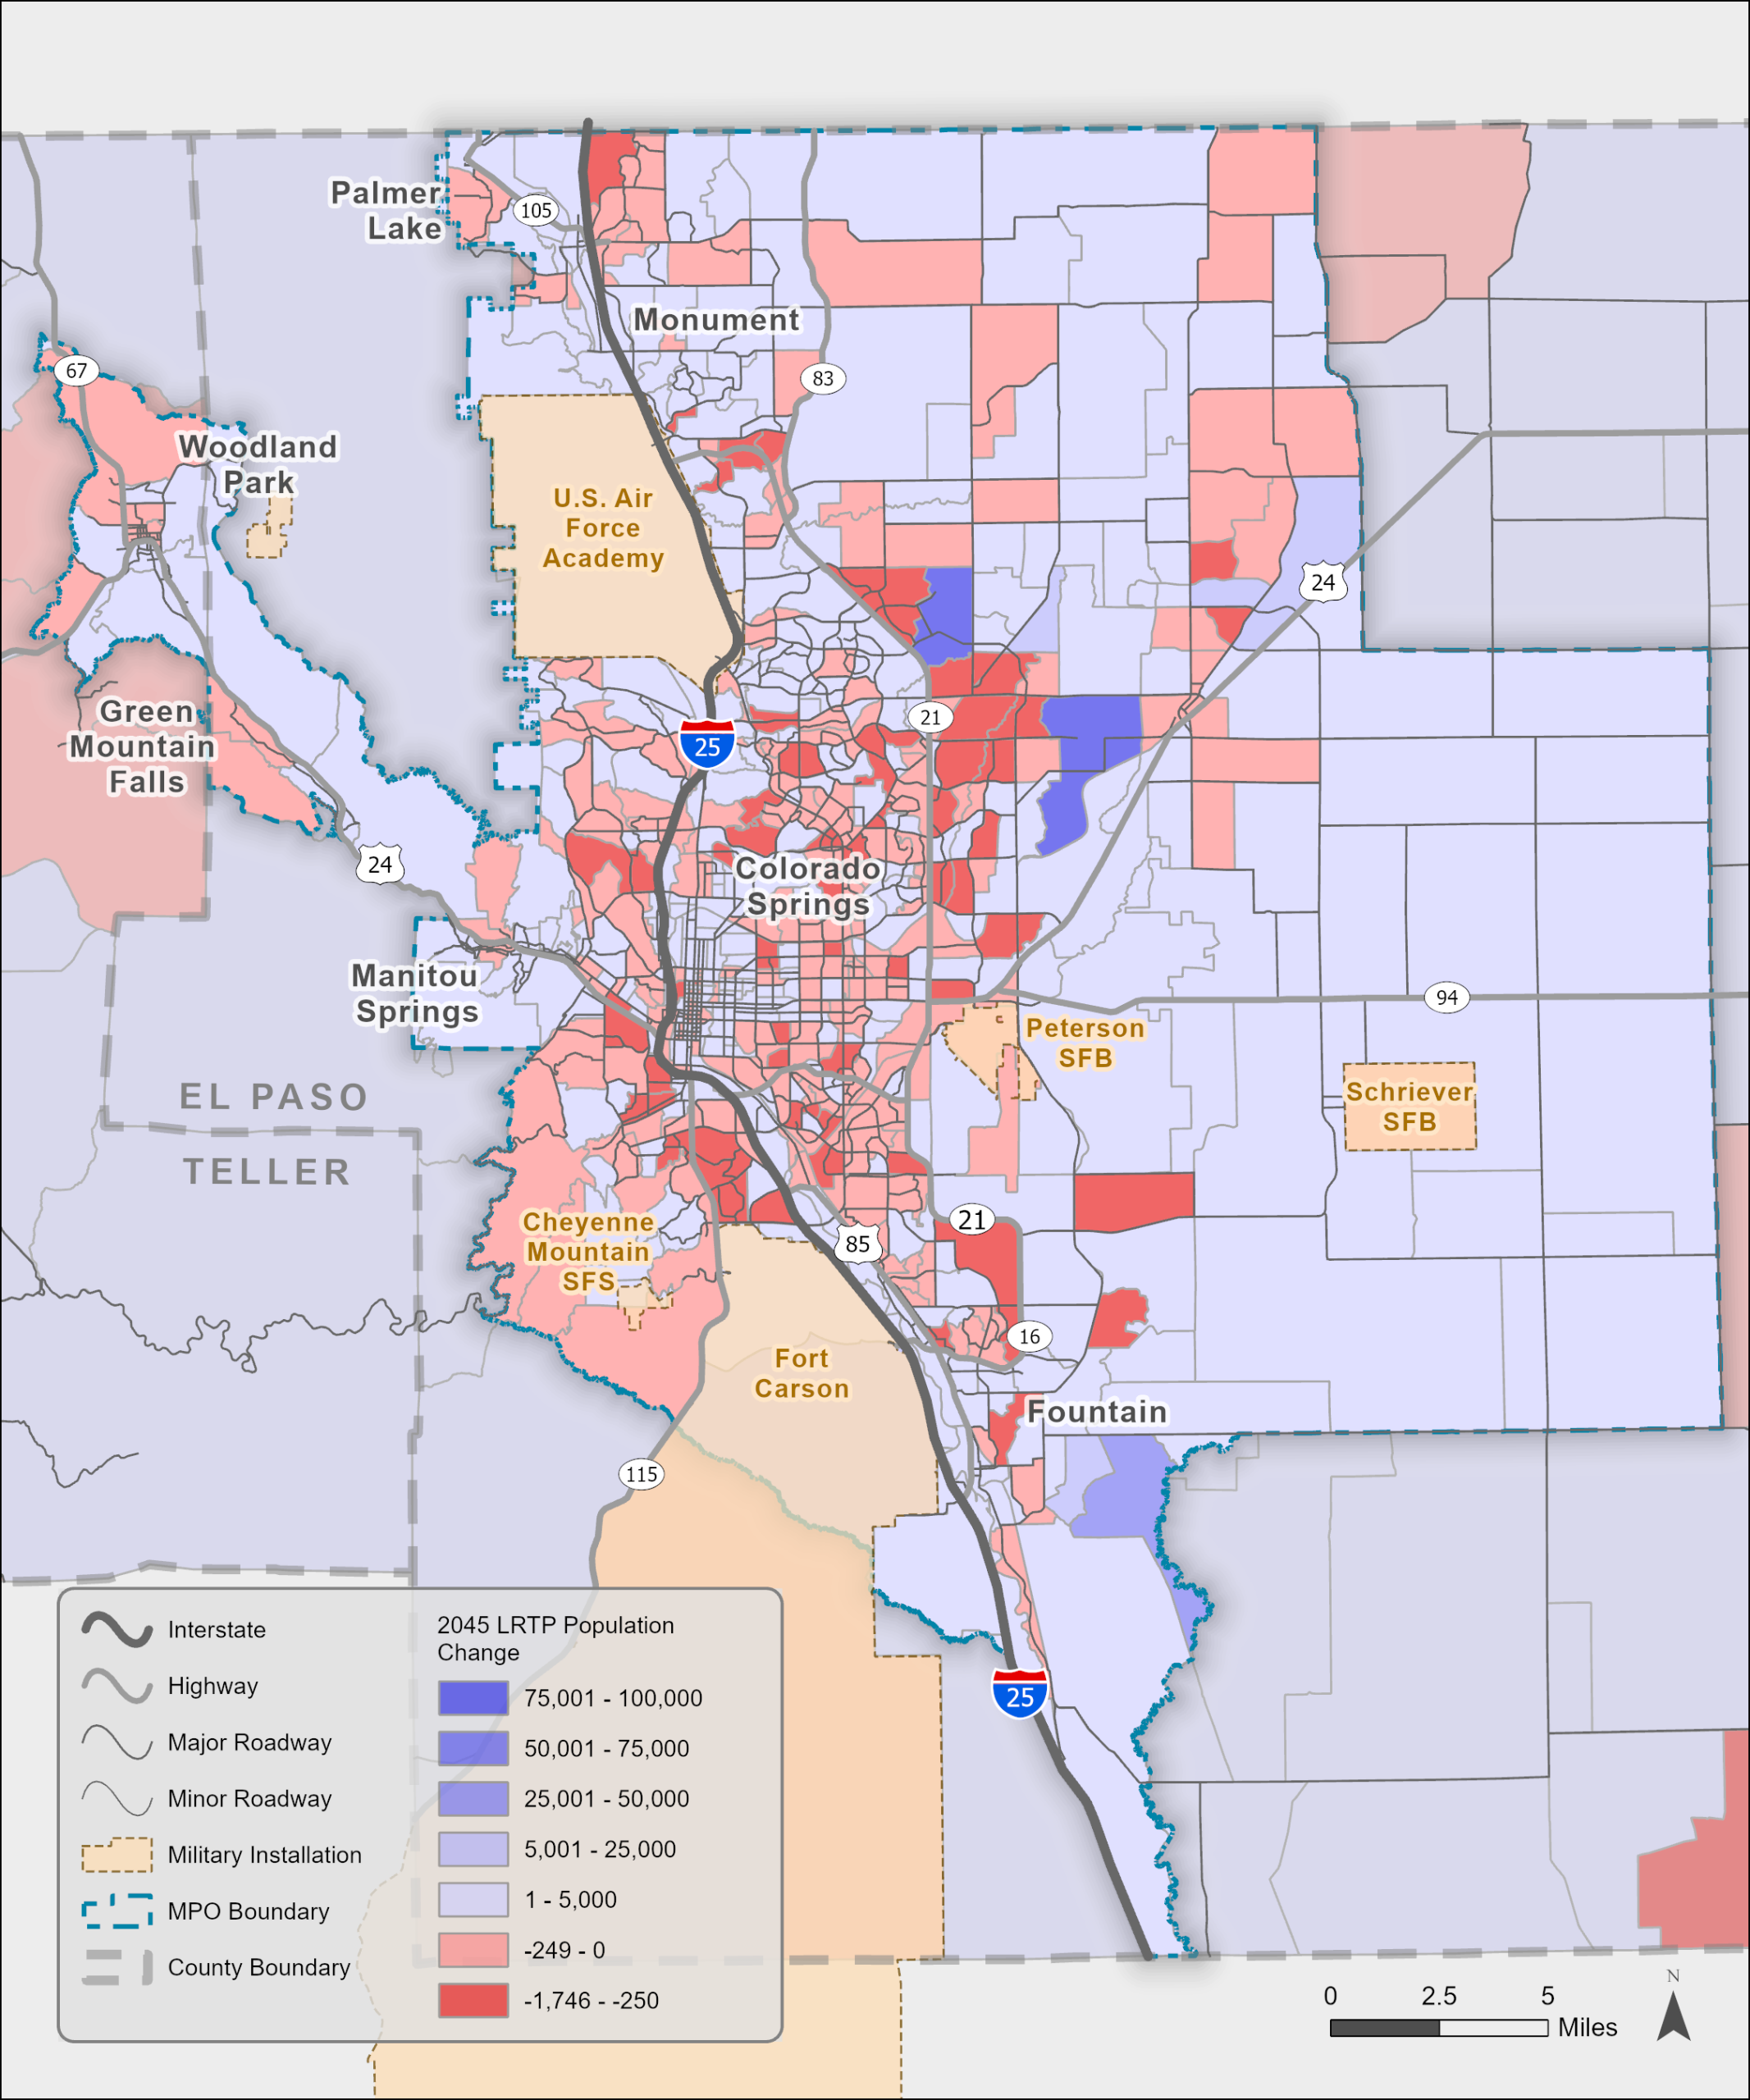
The distribution of population and employment, along with related household socioeconomic factors such as income and size, was modeled using UrbanSim planning software. The results were aggregated into distinct areas called Transportation Analysis Zones (TAZs), which serve as origins or destinations for trips modeled across the transportation network, such as home-to-work or home-to-school trips. TAZs with larger populations or higher concentrations of employees generate more trips to and from their zones. The 2045 plan forecasted significant population growth in a few concentrated areas within the MPO, while projecting a decline in population throughout much of the existing urban area.
Figure 5: Map of forecasted 2045 LRTP population change
The forecasted population and employment changes were added to the regional Travel Demand Model (TDM) along with the plan’s new roadway projects to estimate their combined effect on future travel patterns, and evaluate the alignment of future projects with the plan’s goals of improving access, reducing pollution, and minimizing congestion. The TDM also incorporated several illustrative capital projects as part of a funding gap analysis, which identified unmet transportation needs that could be addressed in future plans if additional funding becomes available. Altogether, the 2045 LRTP travel demand model included 202 new centerline miles of major roadways added to the network over the 20 year forecast period. Since PPACG is not subject to air quality conformity analysis—which requires projects to align with staged implementation timeframes—the majority of the new roadway mileage was added between the 2030 and 2040 planning years rather than distributed across a staged timeline.
Figure 6: Increases in the modeled centerline miles of roadway within the MPO from the 2045 LRTP
| 2020 | 2030 | 2040 | 2045 | |||
| Centerline Miles of Roadway in the MPO | 1,166 mi | 20 miles major new roads | 1,186 mi | 182 miles major new roads | 1,368 mi | 1,368 mi |
The 2045 LRTP also included a mix of transit funding and numerous bicycle and pedestrian projects, such as new multi-use urban trails, however, the travel demand model did not include any new transit lines and did not model pedestrian or bicycle trips as mode choice options.
Vehicle miles traveled (VMT) and population are closely related, as population growth typically drives increases in VMT. A larger population means more people traveling for various purposes, such as commuting to work, attending school, shopping, or accessing services. As the population grows, the number of vehicles on the road often increases, leading to more trips and longer travel distances. However, the relationship between VMT and population is also influenced by factors such as land use patterns, urban density, and transportation options. For example, in car-dependent, sprawling regions, population growth is likely to result in proportionally higher increases in VMT than similar growth in dense urban centers that better accommodate walking or transit mode choices. Understanding this relationship is critical for transportation planning, as it helps predict future travel demand and assess environmental impacts like greenhouse gas emissions.
Figure 7: Vehicle Miles Traveled (VMT) and traffic volume in the MPO from the 2045 LRTP
| 2020 | 2030 | 2040 | 2045 | |
| VMT in the MPO Area | 12,659,333 | 16,800,165 | 18,120,837 | 18,319,508 |
| Total Traffic Volume in the MPO Area | 60,621,529 | 78,640,926 | 78,983,836 | 79,485,959 |
3.2 The 2050 LRTP Land use Forecast
PPACG collaborated with its local government members, particularly planners from Colorado Springs and El Paso County, to evaluate the strengths and weaknesses of the land use forecast developed for the 2045 LRTP. A primary concern was the forecast’s overemphasis on population growth in two major planned developments, which understated the potential impact of urban infill initiatives and affordable housing projects in other areas of the MPO. In agreement with these concerns, PPACG committed to adopting a new approach for the land use forecast in the 2050 LRTP.
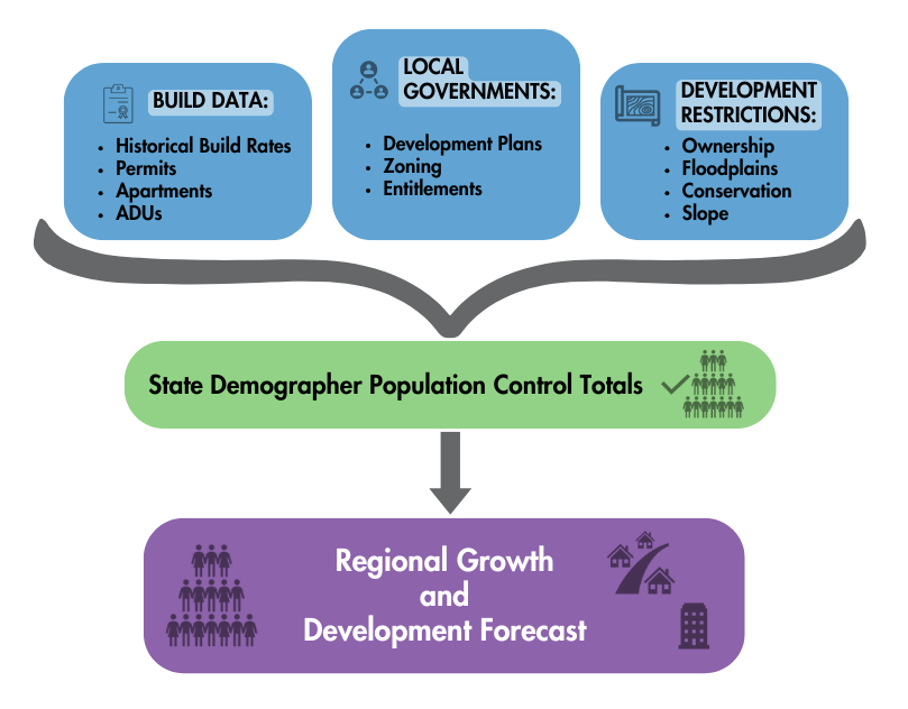
For the 2050 LRTP model, PPACG moved away from independent forecasting using tools like UrbanSim and adopted a more collaborative approach, creating a regional “best-fit” model from all the development plans of its member governments. The process allowed known developments and entitlements to be accounted for in the regional land use forecast alongside the use of historical data like accessory dwelling unit (ADU) permits and residential build rates. When concurrent growth scenarios from multiple jurisdictions ended up exceeding the population control totals, round-table discussions were held to evaluate where growth might be tempered based on historical trends, current and expected development incentives, and utilities requirements.
Figure 8: 2050 LRTP Land Use Forecast Process
This effort resulted in a new regional growth dataset that offers a unified development outlook for the entire MPO area, transcending jurisdictional boundaries while still effectively capturing their planned development patterns. The dataset enables quick evaluation of plans across jurisdictions, facilitating coordination of regional, state, and federal funding initiatives, such as programs for transit-oriented communities or mixed-use developments. Widely embraced by local government and utility planners, the dataset is now a fully maintained resource, supported by ongoing collaborative meetings where updates and changes are reviewed collectively. This process ensures the “best-fit” regional picture is continuously refined as annexations, entitlements, and other development plans are updated.
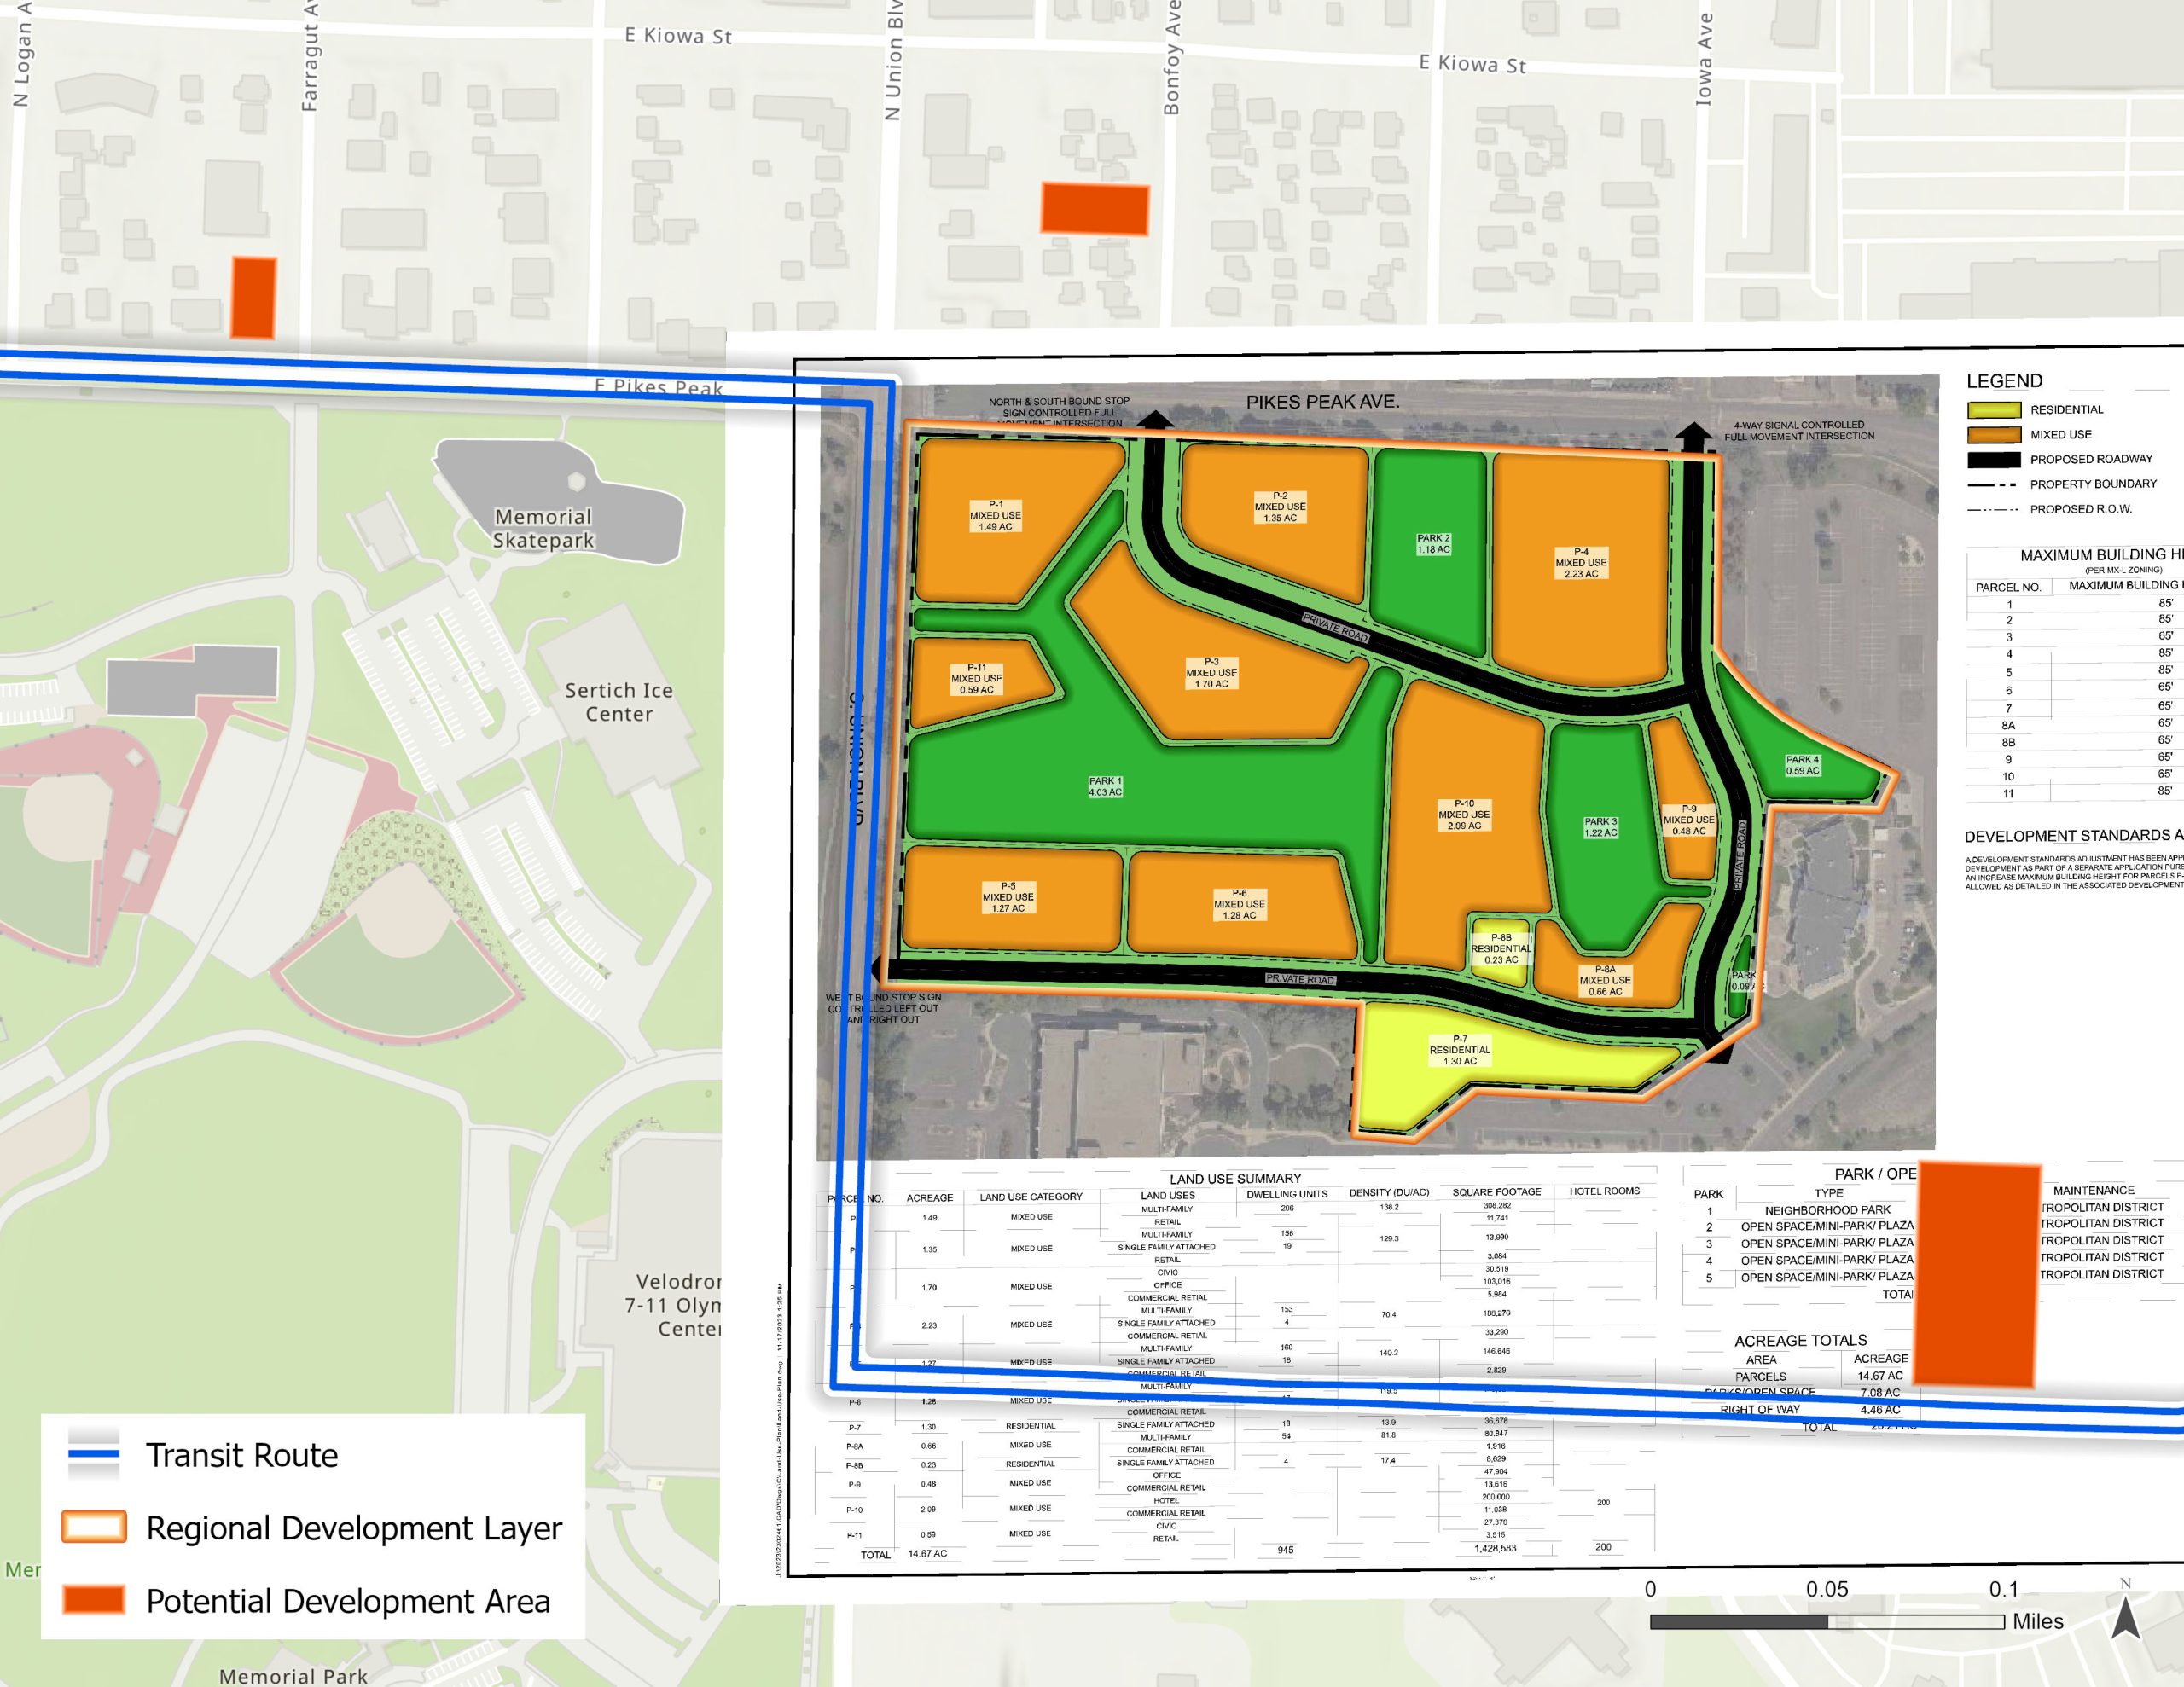
Figure 9: Overview map of the Regional Growth and Development dataset and new home construction in central Colorado Springs, both used to help identify and estimate future land use changes

The new land use model also introduces a transparent approach to employment forecasting. Instead of relying on a “black box” method, it uses development plans, zoning, and entitlements to estimate both the type and number of jobs expected from future commercial and industrial ventures.
Figure 10: A detailed map of the Printers Hill development plan showing housing unit densities, commercial area, and neighboring parks, transit, and other development areas that are all used to forecast changes in population, employment, and trip generation in this area.
The 2050 LRTP land use forecast outlines the anticipated growth and distribution of population and jobs in a cohesive framework that adheres to regional control totals while more accurately reflecting the planning and development goals of the region’s local governments.
Figure 11: Forecasted population from the 2050 LRTP compared to the state demographer’s forecast
| 2030 | 2040 | 2050 | |
| 2050 LRTP Population Forecast | 858,962 | 958,237 | 1,023,259 |
| State Demographer’s Population Forecast (Control Total) | 859,427 | 958,942 | 1,023,342 |
Figure 12: Map of forecasted 2050 LRTP population change
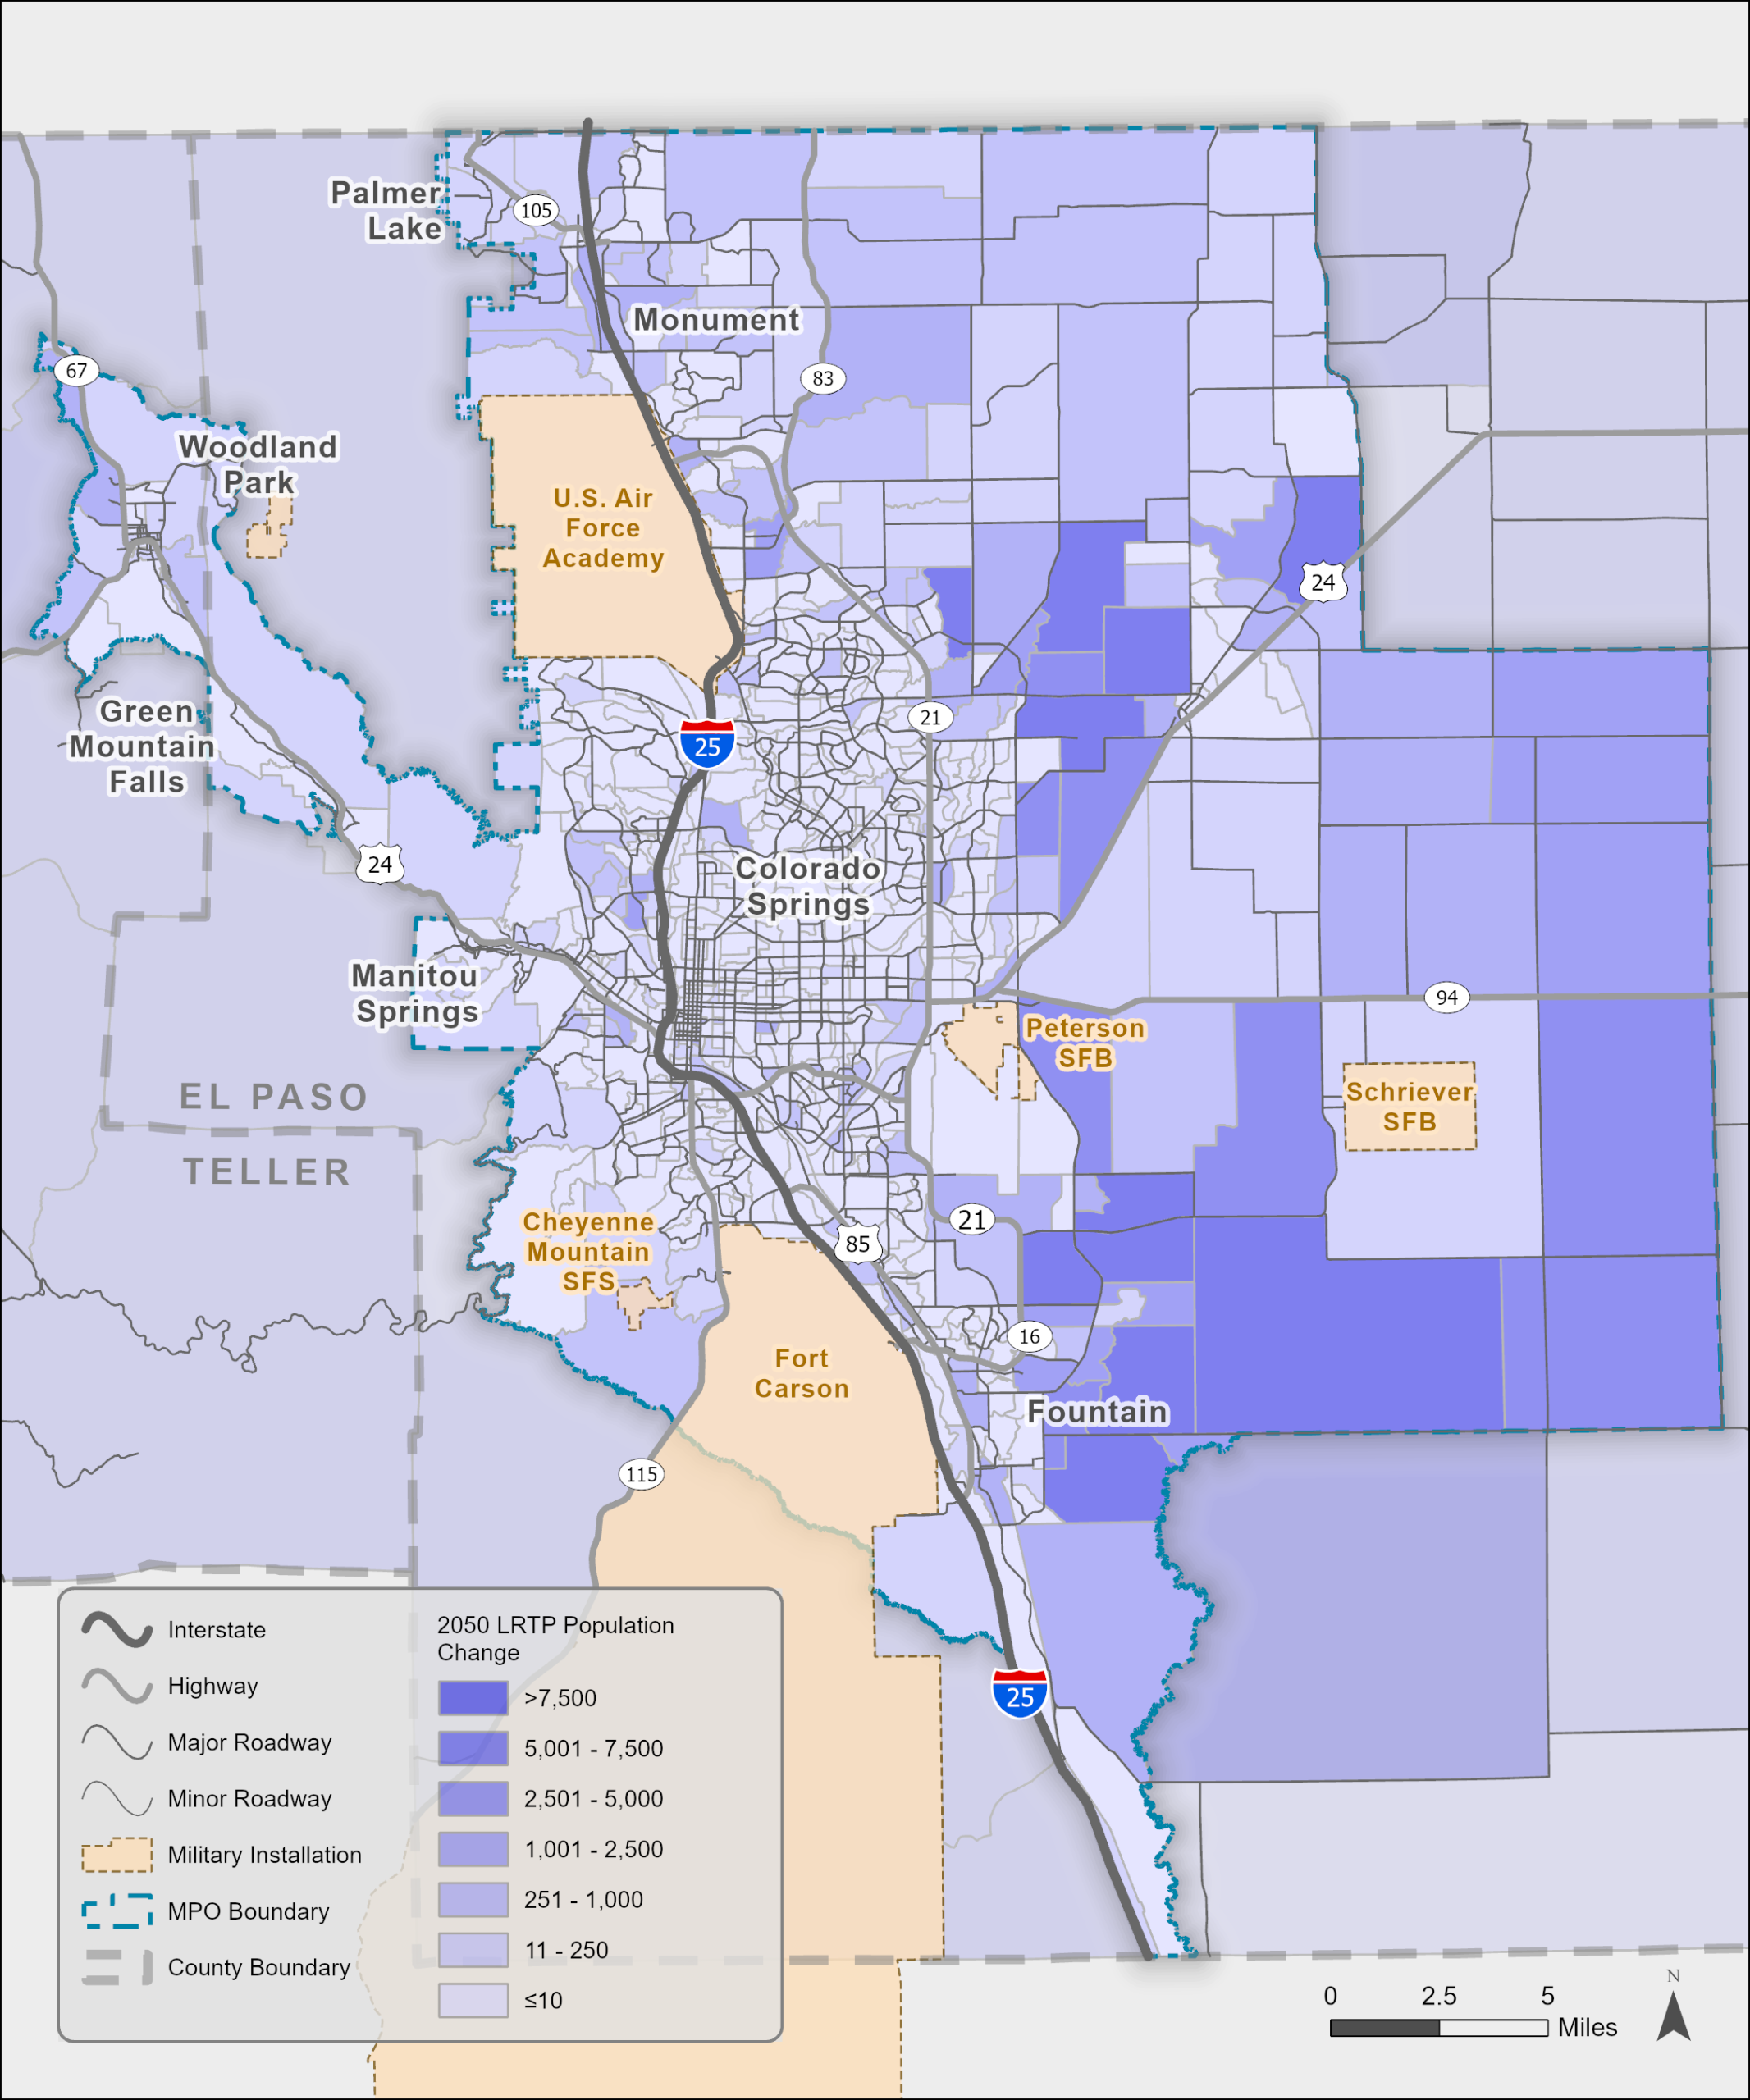
Figure 13: Table of the five employment categories used in the 2050 LRTP and their forecasted change 2020 to 2050

3.3 The 2050 LRTP Travel Demand Model
Senate Bill (SB) 21-260 not only established guidelines to address greenhouse gas (GHG) emissions in transportation planning but also expanded the goals of the Multimodal Transportation and Mitigation Options Fund (MMOF) to support improvements to travel demand models. In 2022, the Transportation Commission (TC) awarded PPACG a grant from the state’s MMOF to enhance its Travel Demand Model (TDM) with specific improvements designed to enhance sensitivity to GHG emissions modeling:
- Pedestrian and Bicycle Mode Choice
- Remote Work Considerations
- Simulation Based Assignment
- Induced Demand Sensitivity
PPACG collaborated with the PTV Group to implement those and several other updates for the 2050 model, enhancing the model’s overall accuracy, efficiency, and ability to forecast different scenarios. The resulting 2050 TDM is a tour-based model that integrates detailed roadway facilities, transit lines, synthetic population at the household and person levels, as well as land use variables such as employment, student enrollment, and shopping activity. With a base year of 2020 to align with Census data and the land use model population, the TDM was calibrated to reflect average daily traffic using counts from both 2019 and 2021. Further, hourly traffic counts were utilized to fine-tune hourly travel demand, supporting dynamic traffic assignment.
The model’s key improvements are summarized below, with the full calibration and validation report, including detailed methodologies, available as an appendix item for further review.
3.3.1 New Transportation Analysis Zones (TAZs)
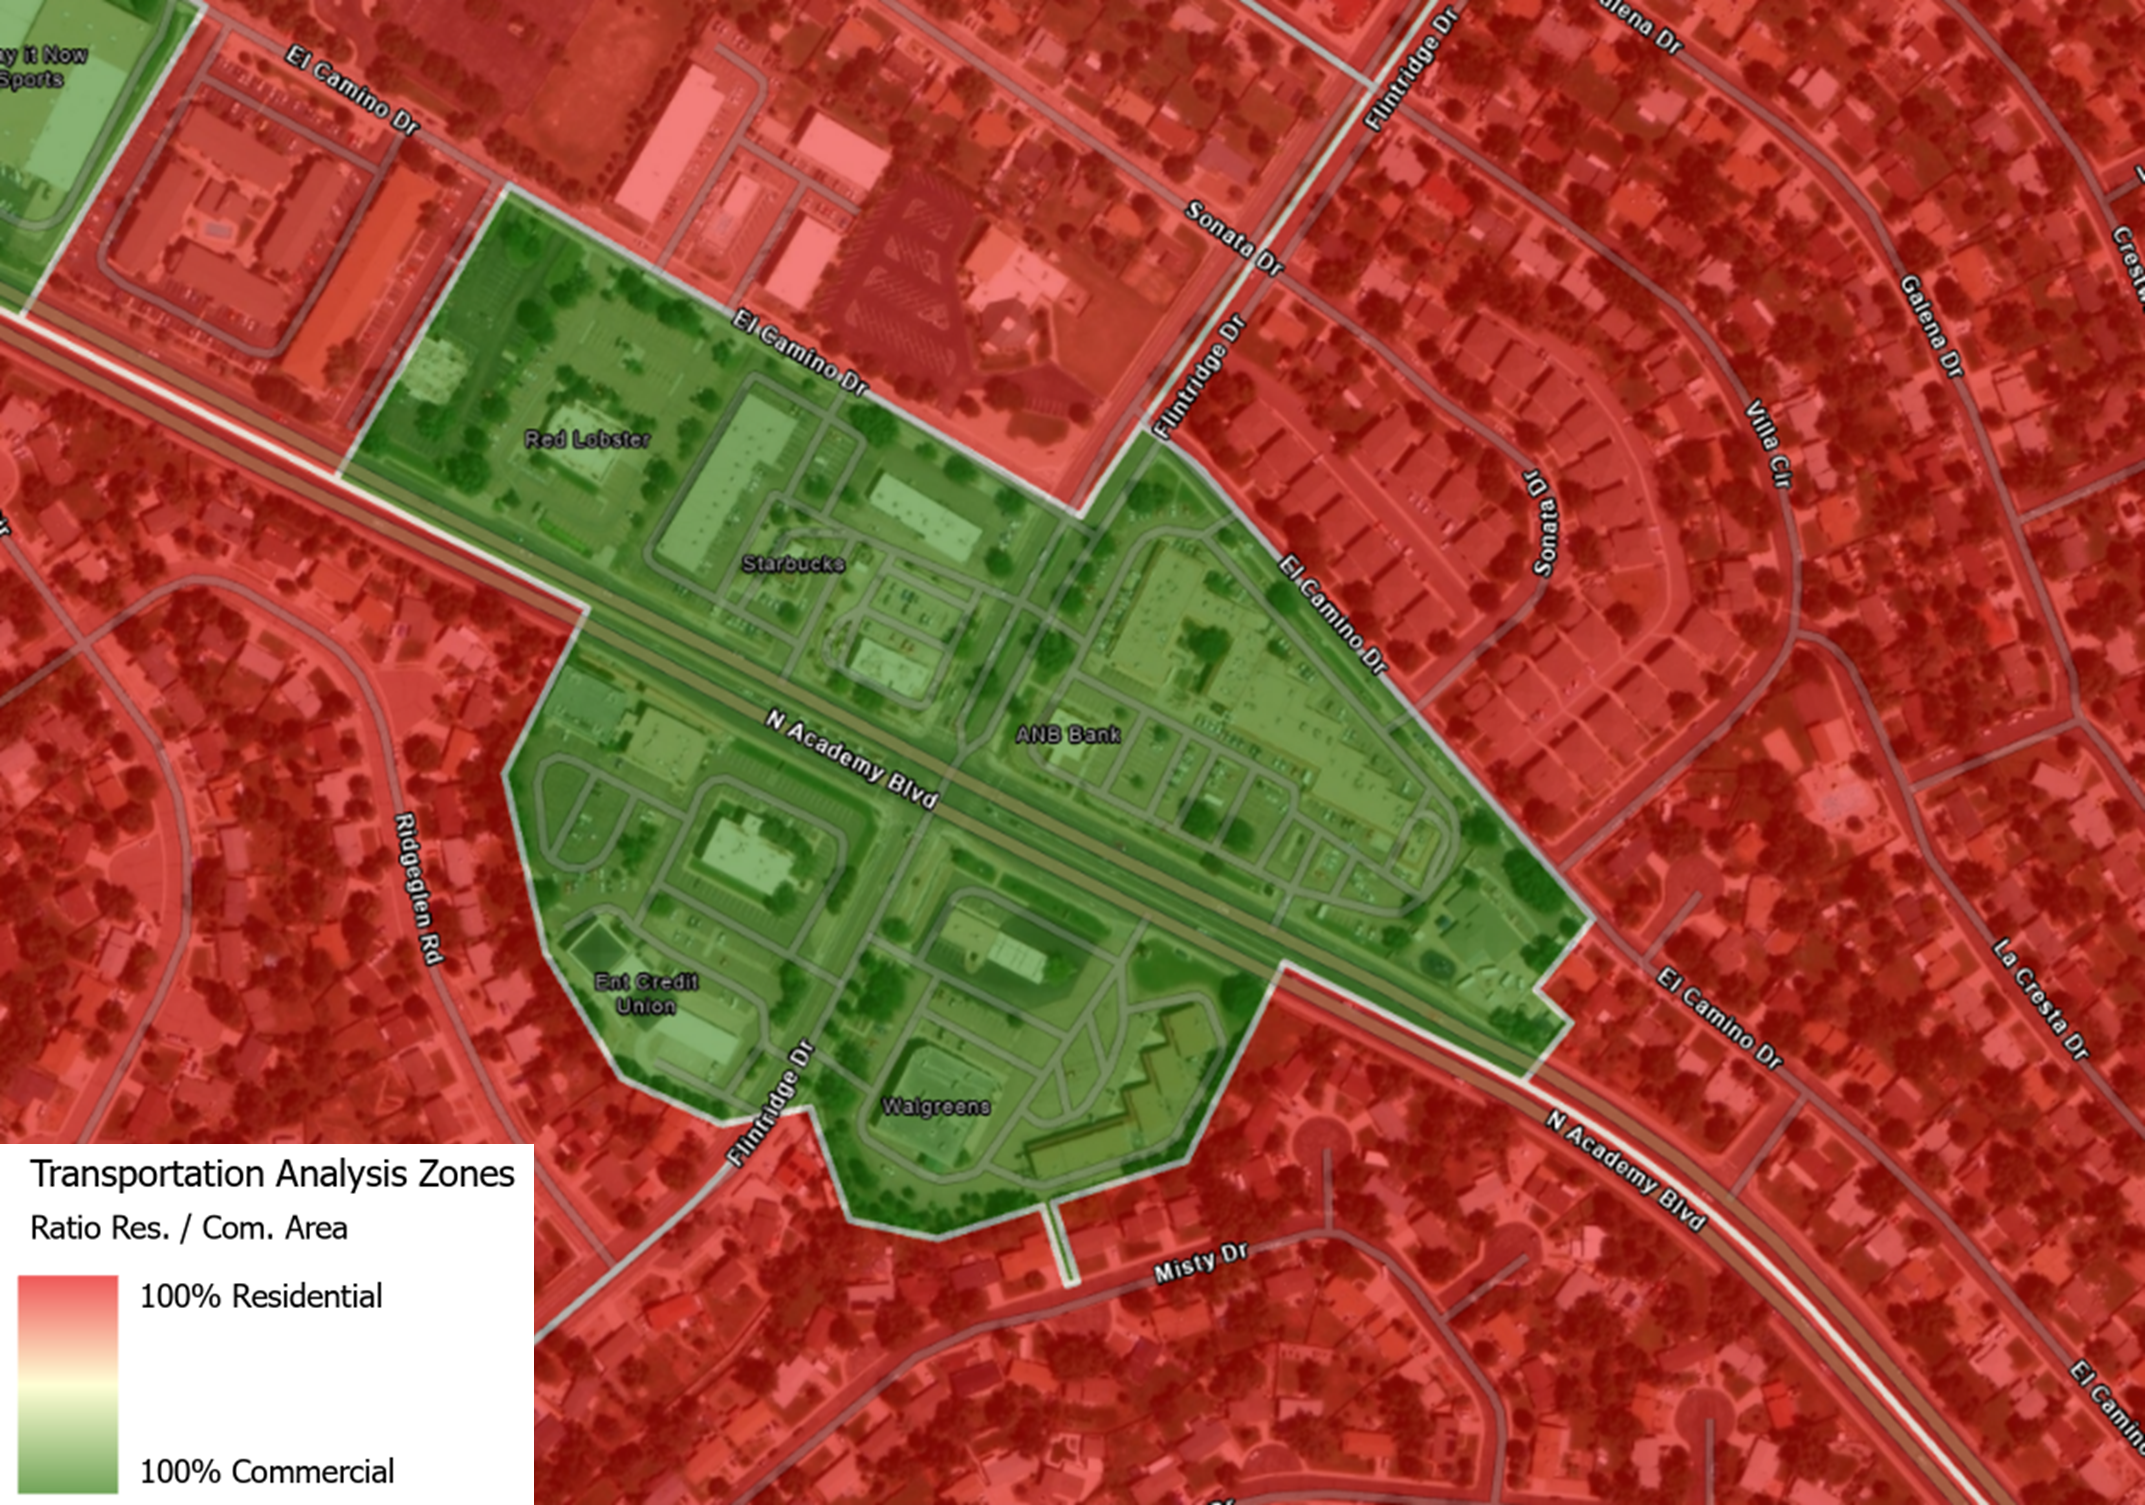
The original TAZ system in the PPACG model was updated to align with the 2020 Census block boundaries and further refined to separate commercial, residential, and military areas into more homogenous zones. These revisions increased the number of zones from 802 to 945, enhancing land use fidelity while maintaining alignment with Census boundaries, simplifying the incorporation of Census data. Additionally, zone connectors—used as access points for traffic and transit trips entering or exiting the network—were improved by adding “stub links” to the network. This change eliminated illogical loading directly into intersections and ensured consistency across both static and dynamic network assignments.
Figure 14: A detailed map of a 100% commercial TAZ surrounded by zones that are almost 100% residential, ensuring that all trips to and from the businesses in this zone are captured in the model
3.3.2 New Population Synthesizer
The PPACG travel model relies on a disaggregate synthetic population to represent individual households and people. This approach enhances the model’s ability to analyze travel behavior across various demographic groups and incorporates factors like work-from-home scenarios more effectively. For the updated model, PPACG partnered with PTV to implement PopulationSim, a more advanced population synthesizer than the PopGen system used in the 2045 model.
PopulationSim uses an entropy-maximization method to balance data and generate consistent population weights. This ensures that variables not directly controlled—such as household size or income—remain accurately distributed while avoiding unrealistic weight expansions. The model also allows for “importance factors,” which adjust the emphasis on different data inputs based on their reliability.
Another key advantage of PopulationSim is its ability to process all geographic areas simultaneously. This prevents errors common in sequential models like PopGen, which can misrepresent smaller population segments such as university students or low-income households. By using simultaneous list balancing, PopulationSim produces a more accurate synthetic population for these groups.
The result is a refined synthetic population that better represents individual and household travel characteristics. This includes detailed socioeconomic variables like income, job type, household composition, and more—creating a model that more accurately reflects real-world transportation choices across diverse populations in the region.
3.3.3 Added Pedestrian and Bicycle Mode Choice
As previously mentioned, the 2045 model lacked the capability to account for pedestrian or bicycle mode choices. To address this, PPACG staff first conducted an extensive GIS analysis to identify all roadways with bike lanes, multi-use shoulders, adjacent trails, and sidewalks. This data was then incorporated into the updated travel demand model network to identify where bicycle and pedestrian mode choices could potentially be utilized when assigning trips between TAZs.
The mode choice probabilities for taking a walk or bike trip are calculated at the individual level based on a variety of person and household attributes derived from the enhanced population synthesizer. For example, reflecting differences in surveyed travel behavior, university students are more likely to choose walking or biking compared to individuals over the age of 65.
Figure 15: Table showing the distribution of work trip mode choice in the 2050 LRTP model
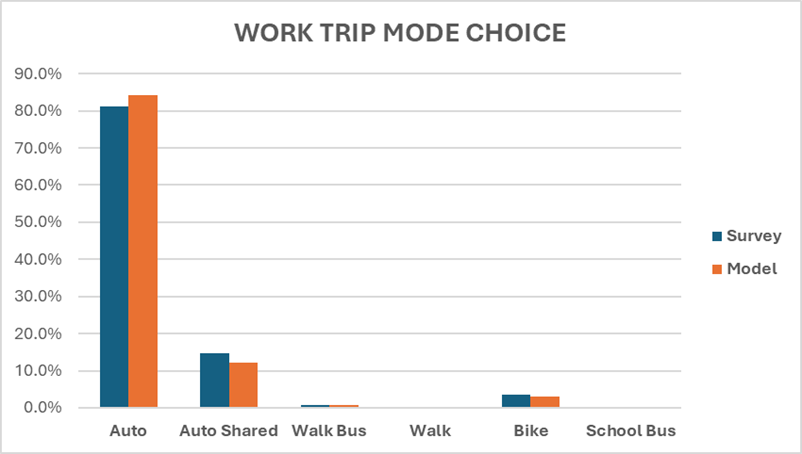
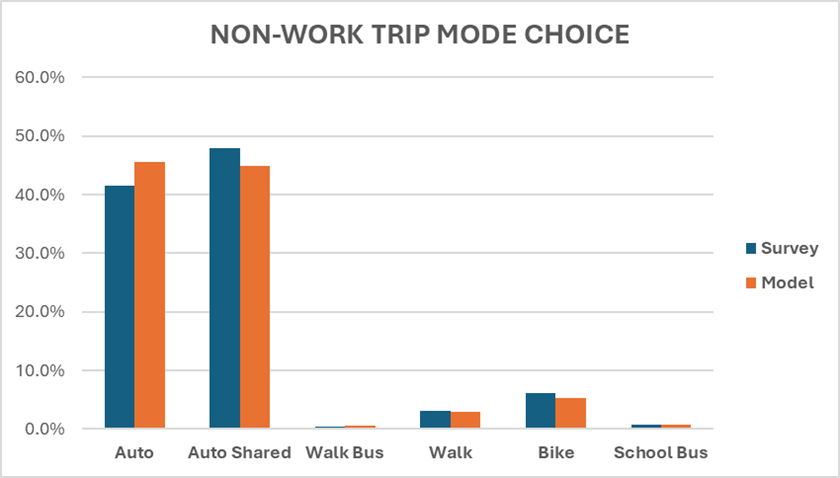
These mode choice options are fully integrated into each individual’s activity chain, enabling the model to represent multi-modal tours for individuals with applicable mode-choice options. This ability is especially useful when modeling non-work trips. For instance, a worker who drives to the office still has a probability of choosing to walk to and from lunch as part of their tour, whereas a person who walks to work won’t have a probability of driving to lunch but may choose to share an auto trip or use a rental e-bike if they choose not to walk. A range of possibilities such as these are now accurately represented in the model, allowing a more realistic depiction of pedestrian and bicycle trips throughout the network.
Figure 16: Table showing the distribution of non-work trip mode choice in the 2050 LRTP model.
3.3.4 Account for Remote Work
A work-from-home component was integrated into the model using socioeconomic data to estimate the likelihood of remote work based on household attributes such as income and job type. To establish initial remote work frequency coefficients, PTV adopted data from the San Diego Association of Governments (SANDAG) travel demand model, which shares similarities with the PPACG region, including a significant military population and the use of PopulationSim. These coefficients account for multiple remote work options, such as hybrid environments where an individual works remotely only two days a week, and were then calibrated for the PPACG region using available remote-work survey data.
PTV ensured the framework for setting remote work probabilities remains adaptable to evolving employer policies. This flexibility is crucial given the ongoing changes in remote work practices post-pandemic. Additionally, the tour generation model accounts for workers whose roles inherently prevent remote work, such as those in the military, manufacturing, or delivery industries.
Figure 17: Table showing the distribution of remote work frequency in the 2050 LRTP model

3.3.5 Simulation Based Assignment
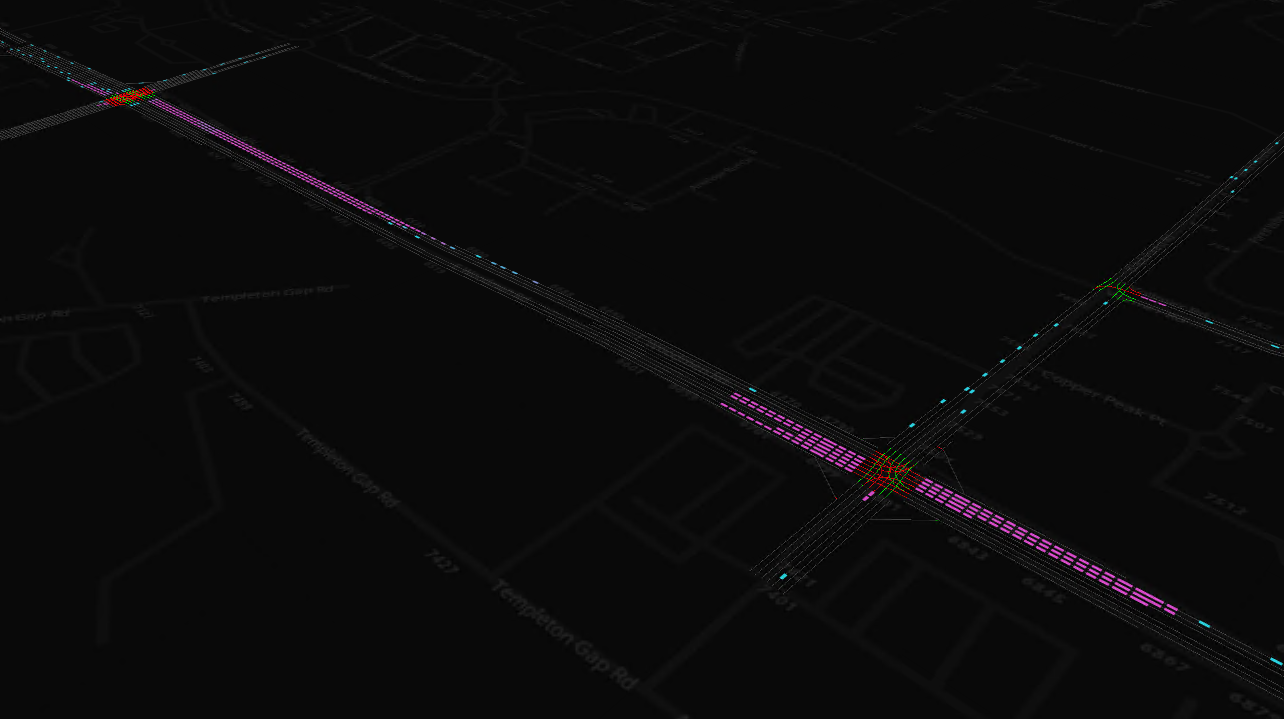
One of the most significant upgrades to the travel demand model is the implementation of a full Simulation-Based Assignment (SBA) procedure. SBA dynamically assigns traffic by simulating individual vehicles and persons traveling within the network. This allows the model to realistically represent intersection delays, including the forming and dissolving of queues over time, enabling signal timing efficiencies and operational improvements to influence mode choice and routing.
This upgrade required the model network to be carefully reviewed for the correct number of roadway lanes, posted speeds, and intersection control types. Aerial imagery was used with GIS to code detailed intersection geometry with appropriate turn bays and lane grouping for over 1,500 intersections in the model network.
There are approximately 700 signalized intersections in the network. To simulate traffic queues forming at these intersections, signal phasing plans were developed based on the lane grouping at each approach leg. Green times and splits were calculated using the turn flows obtained from the static traffic assignment, providing a consistent representation of delay across the network. This methodology also ensures compatibility across forecasted network scenarios.
Simulation-Based Assignment (SBA) provides a more accurate reflection of congestion-related impedance compared to static assignment methods. For instance, vehicles waiting through multiple light cycles at a congested intersection have their “stop-and-go” queue times factored into the average vehicle speeds recorded for that link. This level of detail enables SBA to better represent dynamic traffic conditions and travel times during specific timeframes, enhancing the model’s precision.
Figure 18: Map of an intersection modeled in GIS with lane count, speed, and geometry, including pocket turn lanes, accurately recorded

Figure 19: The same intersection as shown in Figure 18 is displayed in the travel model, with all lanes accounted for and allowable turning movements seen for selected lanes

BA is a powerful tool for transportation planning, enabling more precise simulations of traffic flow and allowing PPACG to work collaboratively with local planners to assess network impacts dynamically. For instance, SBA can evaluate the effects of adjusting signal timings to reduce congestion, analyze the improvement in average vehicle speeds from replacing a congested intersection with an interchange, or model induced demand resulting from such improvements through the reallocation of trips to more attractive routes.
Figure 20: A screen capture of SBA traffic animation along Woodmen Road in Colorado Springs, with pink vehicles queuing at signalized intersections during the morning commute while the light blue vehicles are in motion along the network
The new 2050 LRTP travel model enables transportation engineers and planners to evaluate the impacts of various scenarios, such as changes in population, employment centers, travel behavior, or infrastructure improvements. By projecting future traffic volumes, the model helps avoid the costs of constructing unnecessary roadways or waiting for severe congestion to develop.
3.4 2050 LRTP Project Mix
The primary purpose of the Long-Range Transportation Plan (LRTP) is to define the region’s transportation vision and goals, assess the overall performance of the system, and develop strategies to maximize the effectiveness of public investments in achieving these objectives. To support this mission, the 2050 LRTP incorporates a diverse array of projects submitted by local governments through a collaborative scoring process. These projects are prioritized with input from the Transportation Advisory Committee (TAC), reviewed by other PPACG committees, and refined through public engagement before being adopted by the PPACG Board of Directors. Once adopted, the projects become eligible for funding from various state and federal programs based on their alignment with each funding program’s purpose and eligibility requirements.
3.4.1 Project Funding
The funding available through each program varies annually based on revenue. As of fiscal year 2025, the Pikes Peak region receives approximately $9 million in Surface Transportation Block Grant (STBG) funds, $900,000 in Transportation Alternatives Program (TAP) funds, $1.2 million in Carbon Reduction Program (CRP) funds, and $1.4 million from the Multimodal Transportation and Mitigation Options Fund (MMOF) each year. The specific eligibility requirements of each program means not all funds can be used to support all project types. For example, TAP and MMOF are generally restricted to multi-modal projects like bicycle and transit initiatives. STBG is the most versatile funding source, supporting a wide range of projects and the only funding stream managed by PPACG that can be applied to most roadway projects, including bridge repairs, operational improvements, roadway construction, and can also be flexed to transit.
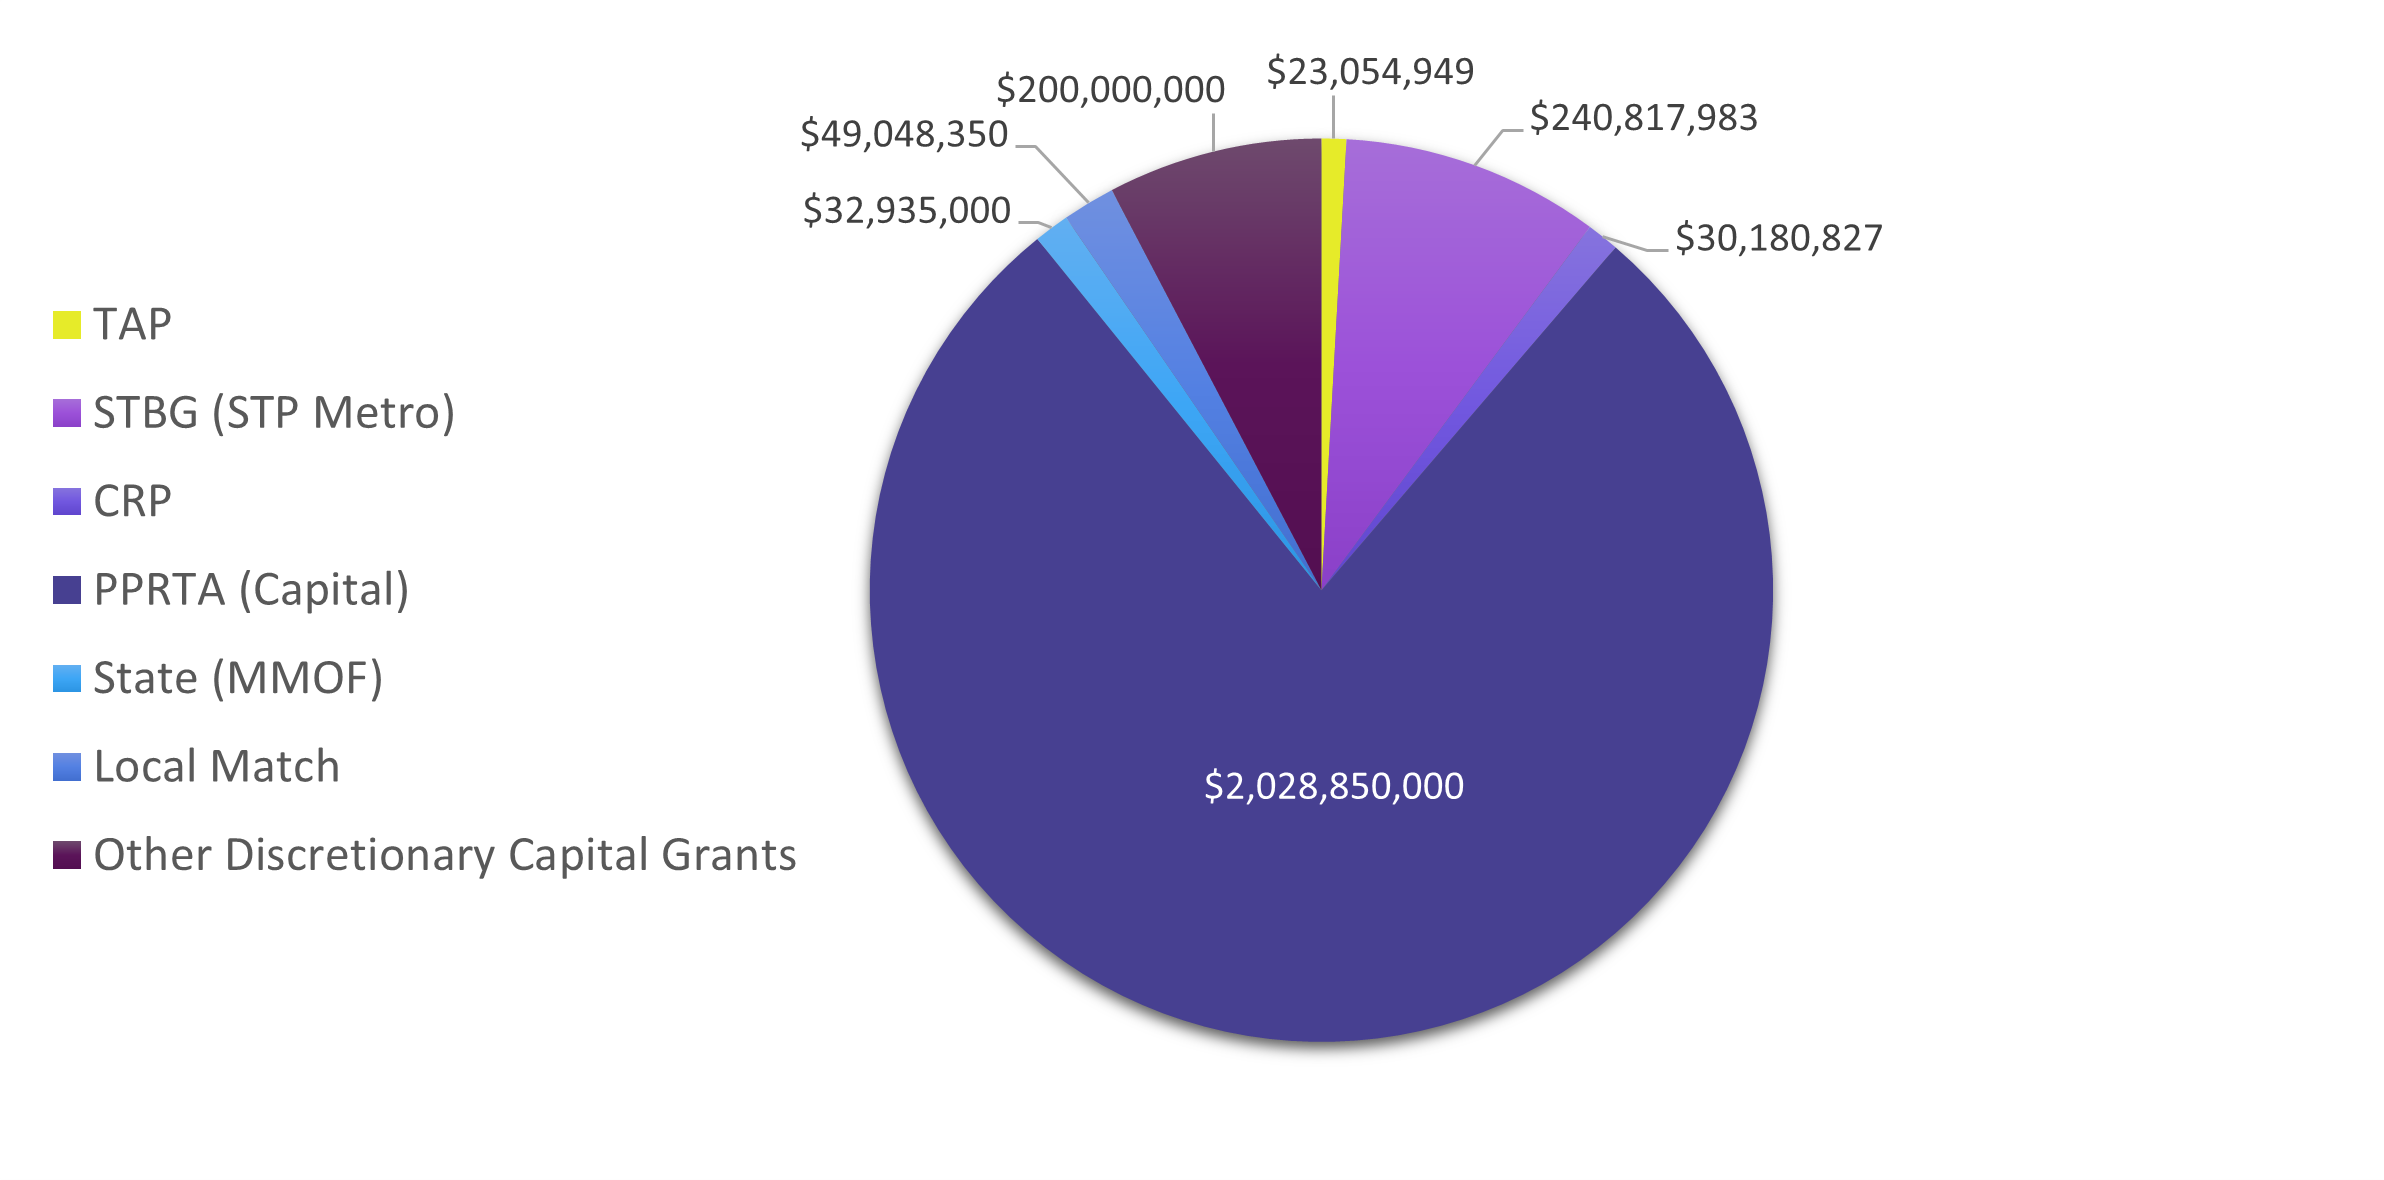
Extended out from 2020 to 2050, the LRTP financial plan estimates approximately $240.8 million in STBG funding, along with $23 million from TAP, $30.2 million from CRP, and $32.9 million from MMOF, all contingent on securing local matching funds. PPACG also calculates additional funds of approximately $200 million from other discretionary capital grants, and $2 billion generated from the local Pikes Peak Regional Transportation Authority (PPRTA) over the same period. These projections do not include transit-specific funding allocated to Mountain Metropolitan Transit, such as FTA 5307 and other federal funds, which are detailed separately in the Regional Transit Study.
Figure 21: Chart of projected transportation funds by program type from 2020-2050
3.4.2 Project Types
Classifying the entire LRTP project list by type presents challenges because many projects encompass multiple elements that could influence their classification. For instance, the CDOT project to widen the section of US24 stretching from CO21 to Stapleton Road is categorized as a capacity project due to the addition of lanes, yet a significant portion of its funding also addresses corridor safety and operational improvements. For this report, projects are classified according to a primary project type and a secondary type based on their most significant components, and therefore the same project may be counted in two separate categories.
Figure 22: Chart of the number of 2050 LRTP transportation projects by type

The first two goals of the LRTP focus on preserving and enhancing the regional transportation system and ensuring it is efficient and fully connected. To support these goals, nearly 45% of the fiscally constrained project list consists of roadway projects, totaling 105 initiatives. Within this category, 22% (51 projects) are classified as roadway operational improvements, 12% (29 projects) address capacity by adding new roads or lanes, and 11% (25 projects) focus on preventative maintenance or reconstruction. Many of these projects also contribute to the system’s resiliency and redundancy.
Among the capacity projects, eight are anticipated to be fully or partially funded by private sources. Six are CDOT-led projects, two of which are currently funded or partially funded through the Transportation Improvement Program (TIP), while one represents the construction phase of an existing TIP project. Of the capacity projects sponsored by local jurisdictions or multiple agencies, three are already partially or fully funded in the TIP, one is part of Phase 2 of an ongoing TIP project, and nine have secured PPRTA voter-approved funding. PPACG expects the remaining capacity projects to be prioritized for future PPRTA funding, as they address critical connectivity needs, enhance safety by updating lane configurations, and fulfill other regional priorities.
In addition to roadway initiatives, nearly 14% (32 projects) are classified as interchange or intersection improvements, and 10% (23 projects) focus on bridges.
The LRTP also prioritizes multimodal transportation and creating a robust, equitable, and healthy system. Recognizing the importance of alternate transportation modes, the project selection process included specific funding sources like the state MMOF and federal TAP programs, which target alternate mode projects. Approximately 16% (49 projects) are bicycle and pedestrian initiatives, with another 13% (30 projects) classified as multimodal improvements. Additionally, over 8% (19 projects) are transit projects, though these do not account for separate transit-specific projects funded by FTA or detailed in the Regional Transit Plan. Specialized transportation initiatives are also excluded from this fiscally constrained list.
Safety remains a critical priority, with 27% of all projects categorized as safety improvements, and nearly 6% classified as ADA enhancements.
Around 10% of the project mix (23 projects) cover transportation studies, plans, water quality improvements, technological advancements, or other transportation-related enhancements. One project, which serves as a PPRTA funding pool for local match contributions to state or federal discretionary grants, was not classified into a specific category.
Because most projects have multiple characteristics, classifying and reporting the project types by their allocated funding is also challenging because many projects can draw from multiple funding sources to address their various elements. For instance, a project might use TAP funding for sidewalks while utilizing STBG funding for roadway operational improvements.
Of note for this report, when considering only the primary project type, the 2050 LRTP designates $182 million for bicycle and pedestrian projects and $76 million for multimodal projects. In comparison, the 2045 LRTP allocated $125 million to active transportation projects, which included both bicycle/pedestrian and multimodal initiatives. When accounting for both primary and secondary project types, the funding totals increase significantly, with $414 million allocated to bicycle and pedestrian projects and $708 million to multimodal projects. Additionally, local transit projects included in the fiscally constrained list and the Regional Transit Plan total approximately $1.5 billion, while 69 fewer centerline miles of new roadway construction are in the 2050 LRTP model network compared to 2045.
The 2050 LRTP project mix highlights the dedication of PPACG and its local governments to addressing the diverse needs of the regional transportation system while promoting sustainable travel solutions. When assessed through the 2050 travel model, these projects demonstrate their collective impact in advancing mobility and significantly reducing greenhouse gas emissions, paving the way for a cleaner, more connected future.