
Title
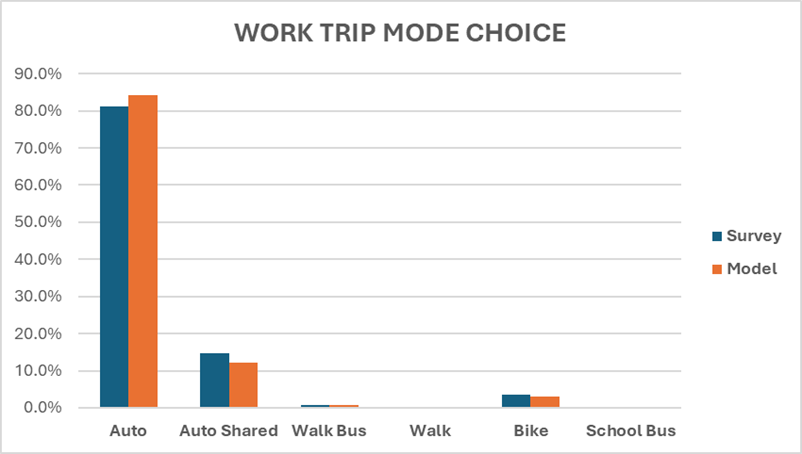
Table showing the distribution of work trip mode choice in the 2050 LRTP model
Alternative Text for Graph
A graph of a work trip mode choice
Text Version
Raw data from the graph is not available. The graph shows percentages of work trips by mode choice made by automobiles, shared automobiles, walking and taking the bus, walking only, cycling, and by school bus. The graph also shows those modes based on surveyed and modeled results.
- For automobiles, surveyed number is slightly greater than 80 percent and the modeled number is approximately 84-85 percent.
- For shared automobiles, the surveyed number is approximately 15 percent, and the modeled number is slightly greater than 10 percent.
- For walking and taking the bus, both surveyed and modeled numbers are slightly greater than zero percent.
- For cycling, the surveyed number is approximately 2-3 percent, and the modeled number is slightly lower.
- For both walking and taking the school bus, there is no percent for the surveyed or modeled numbers.