
The 2050 RTP includes seven elements (Figure 58) that build upon the four goals (guiding principles) identified in Chapter 1. The 2050 RTP expands coverage, identifies future improvement corridors, addresses regional connectivity, and supports future economic growth. It is cost-unconstrained and outlines how MMT and the region can address future mobility needs. Additional funding will be necessary to implement the vision. The routing suggestions in this chapter are conceptual and will require further feasibility analysis to determine specific streets where new routes could travel as well as locations of any new bus stops.
The key considerations in designing the vision include:
- Expanding upon previous plans
- Identifying a high-quality transit network that will attract more riders
- Supporting changes to land use and shifting employment patterns
- Improving geographic and temporal coverage throughout the region
- Incorporating new technology and capital to improve the customer experience
The complete 2050 RTP is shown in Figure 57. The seven vision elements are presented in Figure 58 and discussed in more detail in this chapter.
Serving the Region’s Military Installations
While the region’s military installations are an important destination for a wide variety of trips, the RTP does not include specific recommendations to expand transit service to these locations. The logistical challenges of passing through the security gates at these locations make regular fixed-route transit or microtransit infeasible. However, many of the projects in this plan provide the foundation for expanding transit access to military bases by:
- Providing fixed-route transit services closer to primary access points outside the security perimeter, where servicemembers and other employees can transfer to transit circulators operated within each installation by the relevant federal agency;
- Exploring the possibility of launching vanpool service that could more easily navigate each installation’s secure access points;
- Increasing transit frequency and reliability on the network as a whole to increase the utilization of transit and create a constituency for expanding transit access to and within the installations themselves.
Figure 57. 2050 Regional Transit Plan

Figure 58. 2050 Regional Transit Plan Elements

Innovative Mobility Zones
Not all growth recently seen (or expected) in the region includes sufficient density to sustain fixed-route transit routes. Until areas can support fixed-route transit, other types of transit services may be able to meet the needs of residents and travelers in these areas to improve access to jobs and essential services. These types of services are referred to in the 2050 RTP as “Innovative Mobility Zones,” and their locations are shown in Figure 59.
Service in these six zones will serve passengers on an on-demand basis where riders can request rides via a call-in number or mobile application. Such an arrangement can be more cost-effective and complement the existing transit network. The service vehicles that can be used for these zones can range from vans or minibuses to shuttles. The service may be directly operated (by the agency) or MMT can contract/operate the services in partnership with transportation network companies like Uber or Lyft. Table 18 presents the service area and recommended annual revenue hours for the six innovative mobility zones.
Table 18. Innovative Mobility Zones
| Innovative Mobility Zone | Size (Sq. miles) | Proposed Annual Revenue Hours |
|---|---|---|
| Northeast | 35.2 | 16,000 |
| Central | 13.4 | 20,000 |
| Northwest | 8.5 | 11,000 |
| Southeast | 32.8 | 15,000 |
| South | 8.8 | 11,000 |
| Northgate/Gleneagle | 9.6 | 11,000 |
| Total | 84,000 | |
| Cost (2024 $) | $7,585,000 |
Figure 59. Innovative Mobility Zones

Enhanced Transit Corridors
Several corridors in the region are proven “workhorses” of the existing transit system, carrying the majority of MMT’s existing riders and connecting many of the key destinations throughout the region. These corridors are the obvious candidates for investing in both additional transit service as well as capital investments to improve bus speed and reliability, benefiting existing riders while also making transit a more competitive travel option to driving. These corridors comprise the Enhanced Transit Corridor (ETC) element of the 2050 RTP, as outlined in Figure 60.
What is an Enhanced Transit Corridor?
An ETC refers to a transit corridor that provides both a higher level of service as well as improved amenities compared to a regular local fixed-route bus. These projects are implemented on corridors with high existing transit ridership, existing or planned transit-supportive land use, and where modifications to the roadway can be made to give buses the ability to compete with the travel times of private cars. The exact infrastructure of an ETC will vary from corridor to corridor depending on the local context and the need, and a more detailed study (called an “alternatives analysis”) is typically conducted for each project to define the project in partnership with the community. These types of projects are the most capital-intensive of the proposed solutions, but are also eligible for a variety of outside grant funding opportunities at both the federal and state levels.
Figure 60. Examples of Enhanced Transit Corridor Types

Figure 61. Proposed 2050 Enhanced Transit Corridors

The 2050 RTP includes upgrading six corridors to provide fast, frequent, and reliable service to the parts of the region with the highest concentration of existing and future residents and jobs. Enhanced bus service would replace some of the existing routes to serve existing transit riders more efficiently while attracting new riders. Improvements would include higher frequency, longer service spans, and short-term bus stop amenities and improvements. For instance, the routes would operate every 15 minutes or better during the day on weekdays and weekends and 30 minutes at all other times, and the service spans would be enhanced to serve from morning until midnight on weekdays and Saturdays and from morning to 9:00 p.m. on Sundays. Table 19 presents the existing and proposed annual revenue hours for the six enhanced bus corridors. Note that in some cases – like Tutt Boulevard – the ETC represents an expansion of fixed-route service beyond the reach of the most relevant current transit service, so the change in revenue hours reflects both the increased level of service as well as the expanded geographic coverage of the route.
Table 19. Enhanced Transit Corridors
| ETC | Replaces Existing Route(s) | Existing Annual Revenue Hours | Proposed Annual Revenue Hours | Difference |
|---|---|---|---|---|
| Academy Boulevard | 25, 27 | 31,000 | 68,000 | 37,000 |
| North Nevada | 9, 19, 39 | 22,000 | 38,000 | 16,000 |
| South Nevada | 10, 11, 20 | 10,000 | 26,000 | 16,000 |
| Platte Avenue | 5 | 12,000 | 14,000 | 2,000 |
| Colorado Avenue | 3 | 11,000 | 24,000 | 13,000 |
| Airport | 37 | 10,000 | 48,000 | 38,000 |
| Tutt Boulevard | 24 | 6,000 | 37,000 | 31,000 |
| Total | 153,000 | |||
| Cost (2024 $) | $16,000,000 |
New Crosstown Routes
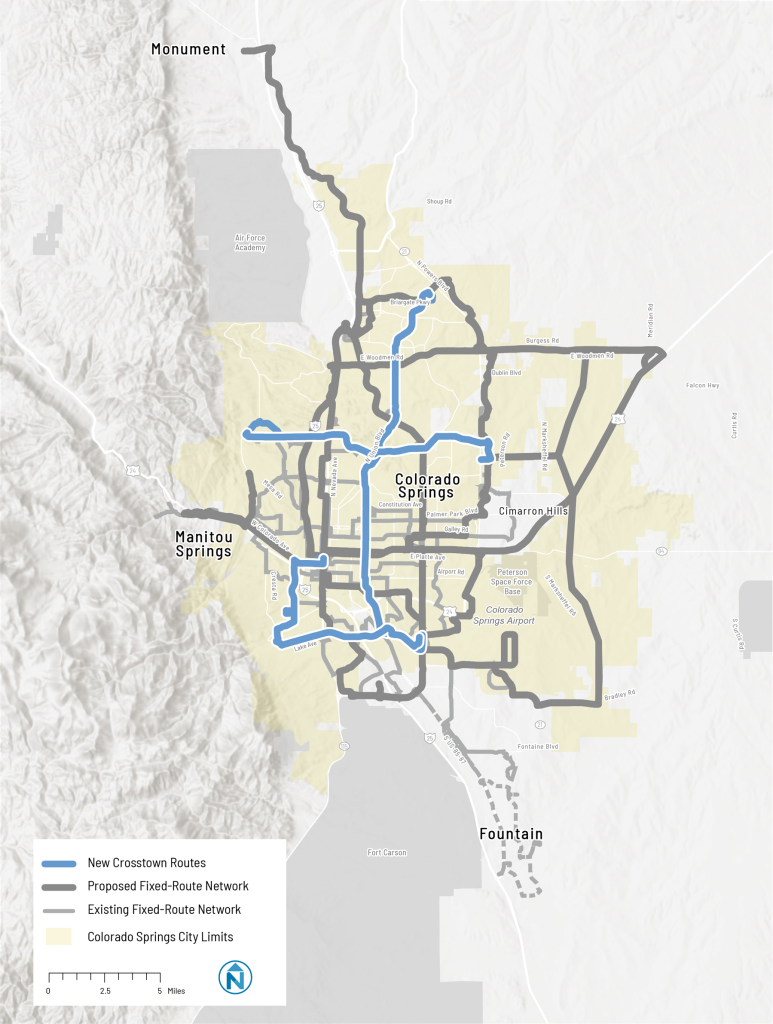
New crosstown routes will improve north-south and east-west crosstown travel and connect many of the ETCs to unlock new travel patterns with fewer transfers than on today’s MMT system. New crosstown routes are shown in Figure 61.
The routes would extend the reach of the regular, fixed-route transit network to regional destinations like UC Health Memorial Hospital North, University of Colorado – Colorado Springs, and the Broadmoor Hotel. The new crosstown routes would replace some of the existing routes and would be implemented in two phases. In the first phase, frequency improvements would be made, and these routes would operate every 30 minutes all day, seven days a week. In the second phase, service spans would be enhanced to serve from morning until midnight on weekdays and Saturdays and from morning to 9:00 p.m. on Sundays. Table 20 presents the existing and proposed annual revenue hours for the three new crosstown routes.
Table 20. New Crosstown Routes
| New Crosstown Routes | Replaces Existing Route(s) | Existing Annual Revenue Hours | Proposed Annual Revenue Hours | Difference |
|---|---|---|---|---|
| Union Blvd | 18, 38 | 9,000 | 32,000 | 23,000 |
| Garden of the Gods/Austin Bluffs | 23, 34 | 13,000 | 22,000 | 9,000 |
| Lake | 4 | 5,000 | 22,000 | 17,000 |
| Total | 49,000 | |||
| Cost (2024 $) | $5,125,000 |
Figure 62. Proposed Crosstown Routes
New Fixed-Routes
A constant theme heard during stakeholder and community feedback was the need to connect fast-growing parts of the region with reliable transit service. Wide swaths of the region to the north and east have seen tremendous growth in both housing and jobs and lack access to transit today, while additional growth in both directions will only exacerbate the number of people who lack access to reliable transit service. To address this gap, the 2050 RTP includes expansion of new local fixed-route transit to serve areas that have seen the most growth and that are most likely to meet the thresholds of people and jobs needed to sustain regular transit service. These routes are shown in Figure 62.
Table 21 presents nine new fixed-routes with recommended annual revenue hours. Out of the nine, two routes; I-25/Voyager Express Service and U.S. 24/Falcon Express Service are new commuter/express routes that would reduce travel time from outlying areas in the Pikes Peak region. For both the Banning Lewis Ranch (North) and Banning Lewis Ranch (South) routes, further analysis is needed to determine if Banning Lewis Parkway or Marksheffel Road is the preferred alignment to serve this part of the region. All routes are proposed to operate from morning until midnight on the weekdays and Saturdays and morning to 9:00 p.m. on Sundays with the exception of Manitou/Garden of the Gods Shuttle that will operate only on Saturdays and Sundays from the morning until 7:00 p.m. All new fixed-routes are proposed to operate every 30 minutes on all operational days.
Table 21. New Fixed-Routes
| New Fixed-Routes | Proposed Annual Revenue Hours |
|---|---|
| Tutt North/Briargate | 28,000 |
| Woodmen | 26,000 |
| Citadel to Astrozon | 18,000 |
| Banning Lewis Ranch (North)* | 22,000 |
| Banning Lewis Ranch (South)* | 44,000 |
| Manitou/Garden of the Gods Shuttle | 2,000 |
| Voyager to Monument | 50,000 |
| I-25/Voyager Express Service | 29,000 |
| U.S. 24/Falcon Express Service | 36,000 |
| Total | 255,000 |
| Cost (2024 $) | $26,665,000 |
*Route could use Banning Lewis Pkwy and/or Marksheffel Rd
Figure 63. New Fixed-Route Transit Service

Improved Service Frequency
Improved frequency and later and earlier service were two of the most desired improvements for existing MMT riders. Improved service directly addresses these top needs. All existing routes (that are not included in the enhanced bus or crosstown routes) would be provided with bus service that runs every 30 minutes on weekdays, Saturdays, and Sundays. This will reduce waiting times, improve connections, and lead to greater system utilization in the City of Colorado Springs. Table 22 shows all the existing routes whose frequency would be enhanced to 30 minutes and the change in the annual revenue hours as a result of the frequency enhancement.
Table 22. Frequency Improvements of Existing Routes
| Route ID | Name | Existing Annual Revenue Hours | Proposed Annual Revenue Hours | Difference |
|---|---|---|---|---|
| 2 | Centennial Blvd – Garden of the Gods Rd | 4,000 | 8,000 | 4,000 |
| 6 | Fillmore St – Citadel Transfer Center | 6,000 | 12,000 | 6,000 |
| 7 | Pikes Peak Ave – Citadel Transfer Center | 10,000 | 11,000 | 1,000 |
| 8 | Cache La Poudre St – Citadel Transfer Center | 4,000 | 8,000 | 4,000 |
| 11 | World Arena – PPSC Centennial Campus | 10,000 | 12,000 | 2,000 |
| 12 | Palmer Park Blvd | 6,000 | 10,000 | 4,000 |
| 14 | Chestnut St – Garden of the Gods Rd | 5,000 | 10,000 | 5,000 |
| 15 | East Fountain Blvd / Cheyenne Mountain Center | 5,000 | 10,000 | 5,000 |
| 16 | Brookside St – Uintah Gardens | 6,000 | 11,000 | 5,000 |
| 17 | 19th St – Fillmore St | 6,000 | 11,000 | 5,000 |
| 22 | Southborough via Murray Blvd | 9,000 | 11,000 | 2,000 |
| 32 | Security – Widefield | 6,000 | 12,000 | 6,000 |
| 35 | Las Vegas St – PPSC Centennial Campus | 5,000 | 7,000 | 2,000 |
| Total | 51,000 | |||
| Cost (2024 $) | $5,335,000 |
Improved Service Span
Improved frequency and later and earlier service were two of the most desired improvements for existing MMT riders. Improved service directly addresses these top needs.
Earlier and later service would be provided on all the existing routes that are not described in the enhanced bus service or crosstown route sections. Service on all routes would begin at 6:00 a.m. on weekdays, 6:30 a.m. on Saturdays, and 7:00 a.m. on Sundays. Service would be extended until midnight on weekdays and Saturdays and until 9:00 p.m. on Sundays. Table 23 presents all the existing routes whose service span would be improved and the resultant change in the annual revenue hours.
Table 23. Span Improvements of Existing Routes
| Route ID | Name | Existing Annual Revenue Hours | Proposed Annual Revenue Hours | Difference |
|---|---|---|---|---|
| 1 | Hillside – Hancock Plaza | 20,000 | 22,000 | 2,000 |
| 2 | Centennial Blvd – Garden of the Gods Rd | 4,000 | 10,000 | 6,000 |
| 6 | Fillmore St – Citadel Transfer Center | 6,000 | 15,000 | 9,000 |
| 7 | Pikes Peak Ave – Citadel Transfer Center | 10,000 | 12,000 | 2,000 |
| 8 | Cache La Poudre St – Citadel Transfer Center | 4,000 | 9,000 | 5,000 |
| 11 | World Arena – PPSC Centennial Campus | 10,000 | 13,000 | 3,000 |
| 12 | Palmer Park Blvd | 6,000 | 12,000 | 6,000 |
| 14 | Chestnut St – Garden of the Gods Rd | 5,000 | 13,000 | 8,000 |
| 15 | East Fountain Blvd / Cheyenne Mountain Center | 5,000 | 12,000 | 7,000 |
| 16 | Brookside St – Uintah Gardens | 6,000 | 14,000 | 8,000 |
| 17 | 19th St – Fillmore St | 6,000 | 14,000 | 8,000 |
| 22 | Southborough via Murray Blvd | 9,000 | 13,000 | 4,000 |
| 32 | Security – Widefield | 6,000 | 14,000 | 8,000 |
| 35 | Las Vegas St – PPSC Centennial Campus | 5,000 | 8,000 | 3,000 |
| Total | 79,000 | |||
| Cost (2024 $) | $8,260,000 |
Capital Infrastructure
Investment in infrastructure is needed to improve access to transit and attract more riders. New or expanded transit centers would provide more space for buses to connect/transfer passengers and facilitate expansion of the fixed-route transit network as envisioned in the 2050 RTP. Locations for these new transit centers are shown in Figure 63.
The vision includes an additional set of programmatic investments in supportive transit infrastructure to improve passenger experience. New mobility hubs would provide first/last mile connections to access the bus, such as bicycle and scooter parking/rentals. Bus stops would be improved to meet ADA standards and include new amenities like benches and shelters.
Speed and reliability improvements would speed up bus service and ensure buses operate on time. Because these types of investments often occur on right-of-way that MMT doesn’t directly control, these programs would be established as partnerships with local governments, and further coordination is needed to define roles, responsibilities, and funding sources.
Types of Bus Infrastructure
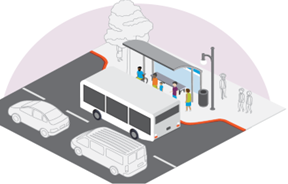
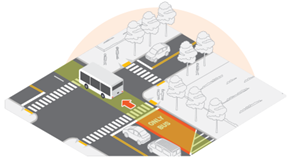
In order to make transit a more competitive travel mode, MMT can partner with local governments to make strategic investments in infrastructure that speed up the boarding process, allow buses to avoid congestion at traffic signals, and (where feasible) give buses their own space within existing roadways. Examples of bus speed and reliability infrastructure include:
Curb Extensions, which speed up the time it takes for buses to load and unload passengers;
Queue Jumps, which can give buses a head start getting through congested intersections;
And Bus Lanes, which provide dedicated space for buses where it is most needed.
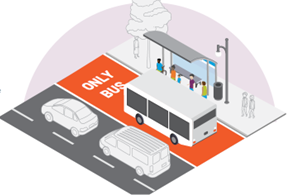
Figure 64. New Transit Facilities

What is a Mobility Hub?
A key component to a successful high frequency transit system is offering an inviting place for riders to begin and end their journey. Mobility Hubs play a vital role in the network by facilitating safe and easy connections between travel modes. They create welcoming and enticing environments for travelers that include amenities, information resources and both public and private transit services. They provide site-specific services and amenities to create a user experience that is above and beyond what most basic transit stations or Park & Rides typically provide.
The 2050 RTP includes enhancements that will refresh existing Park and Rides and Transit Centers to more closely meet the definition of true, modern Mobility Hubs. Mountain Metro’s Mobility Hubs will be high quality transit and multimodal sites that serve as the origin, destination and/or transfer point for a significant portion of trips within the regional transit network.
Transit Transfer Points
Mobility Hubs make transferring between different transportation modes and services easy, safe and efficient.
Comfortable Walking Destination for All
A great pedestrian environment makes Mobility Hubs accessible to everyone — not just the very dedicated.
Context-Sensitive Designs Well-adapted to Sites
Mobility Hubs are more than just functional. They are also welcoming, enjoyable, safe, intuitive and enticing.
Popular Place for Private Mobility Services
Successful Mobility Hubs need to be in places that make sense for transportation users and providers alike. This could include Transportation Network Companies (TNCs) like Uber and Lyft, or shared bicycle or scooter providers.
2050 RTP Performance
After confirming the 2050 RTP with stakeholders and the public, the project team conducted an evaluation of how the RTP performs according to the established goals of the transit plan. The evaluation quantifies the benefits of the future transit network compared to the existing transit network.
The goals and metrics used for system evaluation of the existing and proposed transit network are presented in Table 24. The proposed transit network presents significant benefits over the existing network:
- Nearly doubling the number of people and more than quadrupling the number of jobs within a 5-minute walk of high-frequency (15-minutes or better) transit by 2040.
- Expanding the overall reach of the transit network to serve ~75% more people and ~25% more jobs than the current network would serve by 2040.
- Serving nearly three-quarters of the UZA’s population by transit by 2040 (an increase of more than 26%).
- Reaching 12% more existing public health facilities and 19% more existing educational facilities through the regular fixed-route transit network.
- Expanding the reach of the transit network to thousands of individuals living within equity focus areas.
- Increasing access to low- to moderate-wage jobs through the transit system by nearly 25%.
A complete description of the methodology for calculating systemwide performance measures is included in Appendix B.
Table 24. System Evaluation
| Goal | Metric | Existing Network | 2050 RTP Network | Change |
|---|---|---|---|---|
| Choice | Population within ¼-mile buffer of routes with 15-minute weekday frequencies (or better)* | 63,078 | 123,118 | +95% |
| Choice | Jobs within ¼ mile of routes with 15-minute weekday frequencies (or better)* | 35,185 | 149,914 | +326% |
| Accessibility | Population within ¼-mile buffer of the transit system* | 337,973 | 596,525 | +77% |
| Accessibility | Jobs within ¼-mile buffer of the transit system* | 267,015 | 326,039 | +22% |
| Accessibility | Percentage of UZA population within ¼ mile of the transit network | 44%Ɨ | 70%ǂ | +26% |
| Accessibility | Percentage of existing public health facilities (with employee count greater than or equal to 20) within ¼ mile of the transit system | 82% | 93% | +12% |
| Accessibility | Percentage of existing education facilities (with employee count greater than or equal to 10) within ¼ mile of the transit system | 63% | 82% | +19% |
| Equity | Population within equity focus areas within ¼-mile buffer of the transit system* | 130,551 | 134,997 | +3% |
| Equity | Low-income jobs within ¼ mile of the transit system♦ | 27,583 | 33,938 | +23% |
* Based on 2040 transportation analysis zone (TAZ) population/employment estimates (PPACG)
Ɨ Based on 2020 TAZ population and 2020 UZA definition
ǂ Based on 2040 TAZ population and approximation of 2040 UZA boundary (TAZs where housing unit density is greater than 200 units per square mile)
♦ Based on 2021 LEHD jobs data
Project Prioritization
The 2050 RTP outlined in this chapter represents the full realization of transit improvements in the Colorado Springs region over the next 25 years but is not constrained by funding or project implementation sequencing. After confirmation of the RTP, the project team conducted a project prioritization process to assign relative importance to each project within each investment theme. By systematically evaluating and prioritizing projects, MMT will position itself to strategically meet the current and future needs of the community, as well as to advance near-term priorities through the implementation process – including through regional funding processes such as the 2050 LRTP.
The project team used six prioritization metrics to answer the question of how well each project met the project’s goals. Those metrics are:
- Existing population density: Number of people per square mile served by the innovative mobility zone or within ¼-mile buffer of the proposed route.
- Existing employment density: Number of jobs (employment opportunities) per square mile served by the innovative mobility zone or within ¼-mile buffer of the proposed route.
- Population growth: Percentage increase in the number of people served by the innovative mobility zone or within ¼-mile buffer of the proposed route.
- Employment growth: Percentage increase in the number of jobs (employment opportunities) served by the innovative mobility zone or within ¼-mile buffer of the proposed route.
- Population growth within equity zone: Percentage increase in the population living within equity focus areas (as identified in Chapter 3) served by an innovative mobility zone or within ¼-mile buffer of the proposed route.
- Implementation readiness: Qualitative assessment of readiness for implementation of transit service improvements.
The assessment of the metrics for each proposed project is based on data received from PPACG which forecast population and employment distribution for the years 2020, 2030, and 2040. Thus, existing population and existing job density metrics correspond to 2020 data, while growth metrics correspond to the ‘change’ between 2020 and 2040. The prioritization analysis was only conducted for discrete projects; programmatic investments such as frequency/span improvements and capital infrastructure investments are expected to be phased and implemented in coordination with route changes and upgrades. Prioritization scores for each metric are reflected on a scale of 1 to 5, with 5 referring to “high” performance and 1 referring to “low” performance.
Table 25. Project Prioritization
| Investment Theme | Project | Population Density Score | Job Density Score | Population Growth Score | Job Growth Score | Serves Riders Equitably Score | Ease of Implementation Score | Overall Score | Category Rank |
|---|---|---|---|---|---|---|---|---|---|
| Enhanced Bus Service | Academy Blvd | 3 | 3 | 1 | 1 | 4 | 5 | 17 | 3 |
| Enhanced Bus Service | North Nevada | 2 | 5 | 2 | 2 | 3 | 5 | 19 | 2 |
| Enhanced Bus Service | South Nevada | 3 | 5 | 3 | 2 | 3 | 1 | 17 | 3 |
| Enhanced Bus Service | Platte Ave | 3 | 5 | 1 | 1 | 5 | 5 | 20 | 1 |
| Enhanced Bus Service | Colorado Ave | 2 | 5 | 2 | 2 | 3 | 3 | 17 | 3 |
| Enhanced Bus Service | Airport | 3 | 3 | 3 | 2 | 5 | 1 | 17 | 3 |
| Enhanced Bus Service | Tutt Blvd | 3 | 3 | 2 | 1 | 3 | 1 | 13 | 7 |
| New Crosstown Routes | Union Blvd | 3 | 3 | 1 | 1 | 4 | 3 | 15 | 1 |
| New Crosstown Routes | Garden of the Gods/Austin Bluffs | 2 | 3 | 2 | 1 | 1 | 5 | 14 | 3 |
| New Crosstown Routes | Lake | 2 | 4 | 2 | 2 | 4 | 1 | 15 | 1 |
| New Fixed-Routes | Tutt North/Briargate | 2 | 3 | 3 | 1 | 1 | 1 | 11 | 6 |
| New Fixed-Routes | Woodmen | 2 | 2 | 4 | 1 | 1 | 3 | 13 | 4 |
| New Fixed-Routes | Citadel to Astrozon | 2 | 2 | 2 | 2 | 5 | 5 | 18 | 1 |
| New Fixed-Routes | Banning Lewis Ranch (North) | 1 | 2 | 5 | 1 | 1 | 1 | 11 | 6 |
| New Fixed-Routes | Banning Lewis Ranch (South) | 1 | 1 | 3 | 5 | 2 | 1 | 13 | 4 |
| New Fixed-Routes | Manitou/Garden of the Gods Shuttle | 1 | 2 | 1 | 1 | 1 | 5 | 11 | 6 |
| New Fixed-Routes | Voyager to Monument | 1 | 2 | 4 | 2 | 1 | 1 | 11 | 6 |
| New Fixed-Routes | I-25/Voyager Express Service | 1 | 3 | 3 | 2 | 2 | 5 | 16 | 2 |
| New Fixed-Routes | US 24/Falcon Express Service | 1 | 3 | 3 | 2 | 3 | 3 | 15 | 3 |
| Innovative Mobility Zones | Northeast | 1 | 1 | 4 | 2 | 1 | 5 | 14 | 5 |
| Innovative Mobility Zones | Central | 5 | 2 | 1 | 2 | 1 | 5 | 16 | 1 |
| Innovative Mobility Zones | Northwest | 2 | 2 | 1 | 1 | 1 | 5 | 12 | 6 |
| Innovative Mobility Zones | Southeast | 1 | 1 | 4 | 5 | 1 | 3 | 15 | 3 |
| Innovative Mobility Zones | South | 3 | 1 | 1 | 5 | 1 | 5 | 16 | 1 |
| Innovative Mobility Zones | Northgate/Gleneagle | 2 | 2 | 3 | 2 | 1 | 5 | 15 | 3 |
A complete listing of prioritization metrics is included in Appendix B.