
PPACG is guided by federal Title VI mandates, and PPACG strives to not only meet these mandates, but to create an overall transparent, and inclusive planning process.
Title VI requires that no person in the United States of America shall, on the grounds of race, color, or national origin, be excluded from the participation in, be denied the benefits of, or be otherwise subjected to discrimination under any program or activity for which PPACG receives federal financial assistance.
PPACG adopted its most recent Title VI and Environmental Justice Plan in June 2023. This plan outlines how PPACG meets Title VI requirements. It also identifies the concentrations of populations within the Pikes Peak region, utilizing an Environmental Protection Agency’s (EPA) mapping tool; provides demographic information per the U.S. Census; and provides information regarding those with limited English proficiency (LEP) in the region.
Methodology for this Analysis
Some analyses examine only the adverse effects of transportation plans and projects. For a metropolitan transportation system, analyses should examine how the Long Range Transportation Plan (LRTP), and the Transportation Improvement Program (TIP) promote the safety, mobility, economic productivity, human environment, natural environment, and other goals identified in state and local plans for all populations served by the transportation agency. A complete analysis examines both the benefits to and adverse effects (or “burdens”) of transportation plans or projects on populations.
The demographic data shown in the following maps comes from the EPA, which utilizes standard and nationally consistent data to highlight places that may have higher environmental burdens and vulnerable populations. The tool offers demographic indexes by combining environmental and demographic indicators in basic geographic units of Census block groups. It records the percentile of each Census block group for the following indicators, and not the actual percentage. Percentiles express all the observations of a given occurrence, below a certain percentage of that occurrence. For example, if an area is at the 57th Percentile in the nation, this means that for the average person the block group score is greater than (or equal to) 57% of the national population. The percentiles in the following maps represent the Census block group compared with the state of Colorado. Using percentiles allows the maps to illustrate higher concentrations of populations relative to the average across the state. Percentiles were used rather than percentages because percentages alone do not provide a good representation of what percent might be considered high for an area.
The geographic framework for the mapping tool was built from 2020 Census TIGER/Line data. This data is analyzed against the mappable transportation projects in the 2050 LRTP.
The maps reveal some distinctive areas that will be helpful in focusing PPACG’s efforts to involve all populations in the planning process, to avoid disproportionate ill effects, and to ensure populations receive benefit from its plans and projects.
When selecting projects for the LRTP, the scoring system and recommendation process allowed for flexibility and considered quality of life and jurisdictional equity concerns based on the expertise of local engineers and planners. It is important to consider both potential adverse effects and benefits. As an example, a transit project might have both benefits and adverse effects for a community: while decreasing travel times and expanding employment opportunities, the same project could also increase air pollution and noise. A road project might improve travel times to certain destinations but also create a barrier separating a population from the broader community. A good analysis accounts for both types of effects at examines the balance of a project’s impact on a community.
Of special concern when reviewing projects and their potential impact is whether an adverse effect is “disproportionately” high. An adverse effect becomes “disproportionate” when that effect 1) is predominantly borne by a community, or 2) will be suffered by the community and is appreciably more severe or greater in magnitude than the adverse effect that will be suffered by the total population. For example, a major widening or roadway project in an area that currently houses disproportionately impacted communities could create more traffic and faster speeds that could have disparate adverse effects on these populations in a region-wide pattern. More traffic could also bring safety and health hazards to already disadvantaged populations. It is not certain that these affects will occur, however, and any final assessment should consider the net effect of mitigating factors and techniques as well as transportation benefits that will come from the projects.
Project Analysis
People of Color
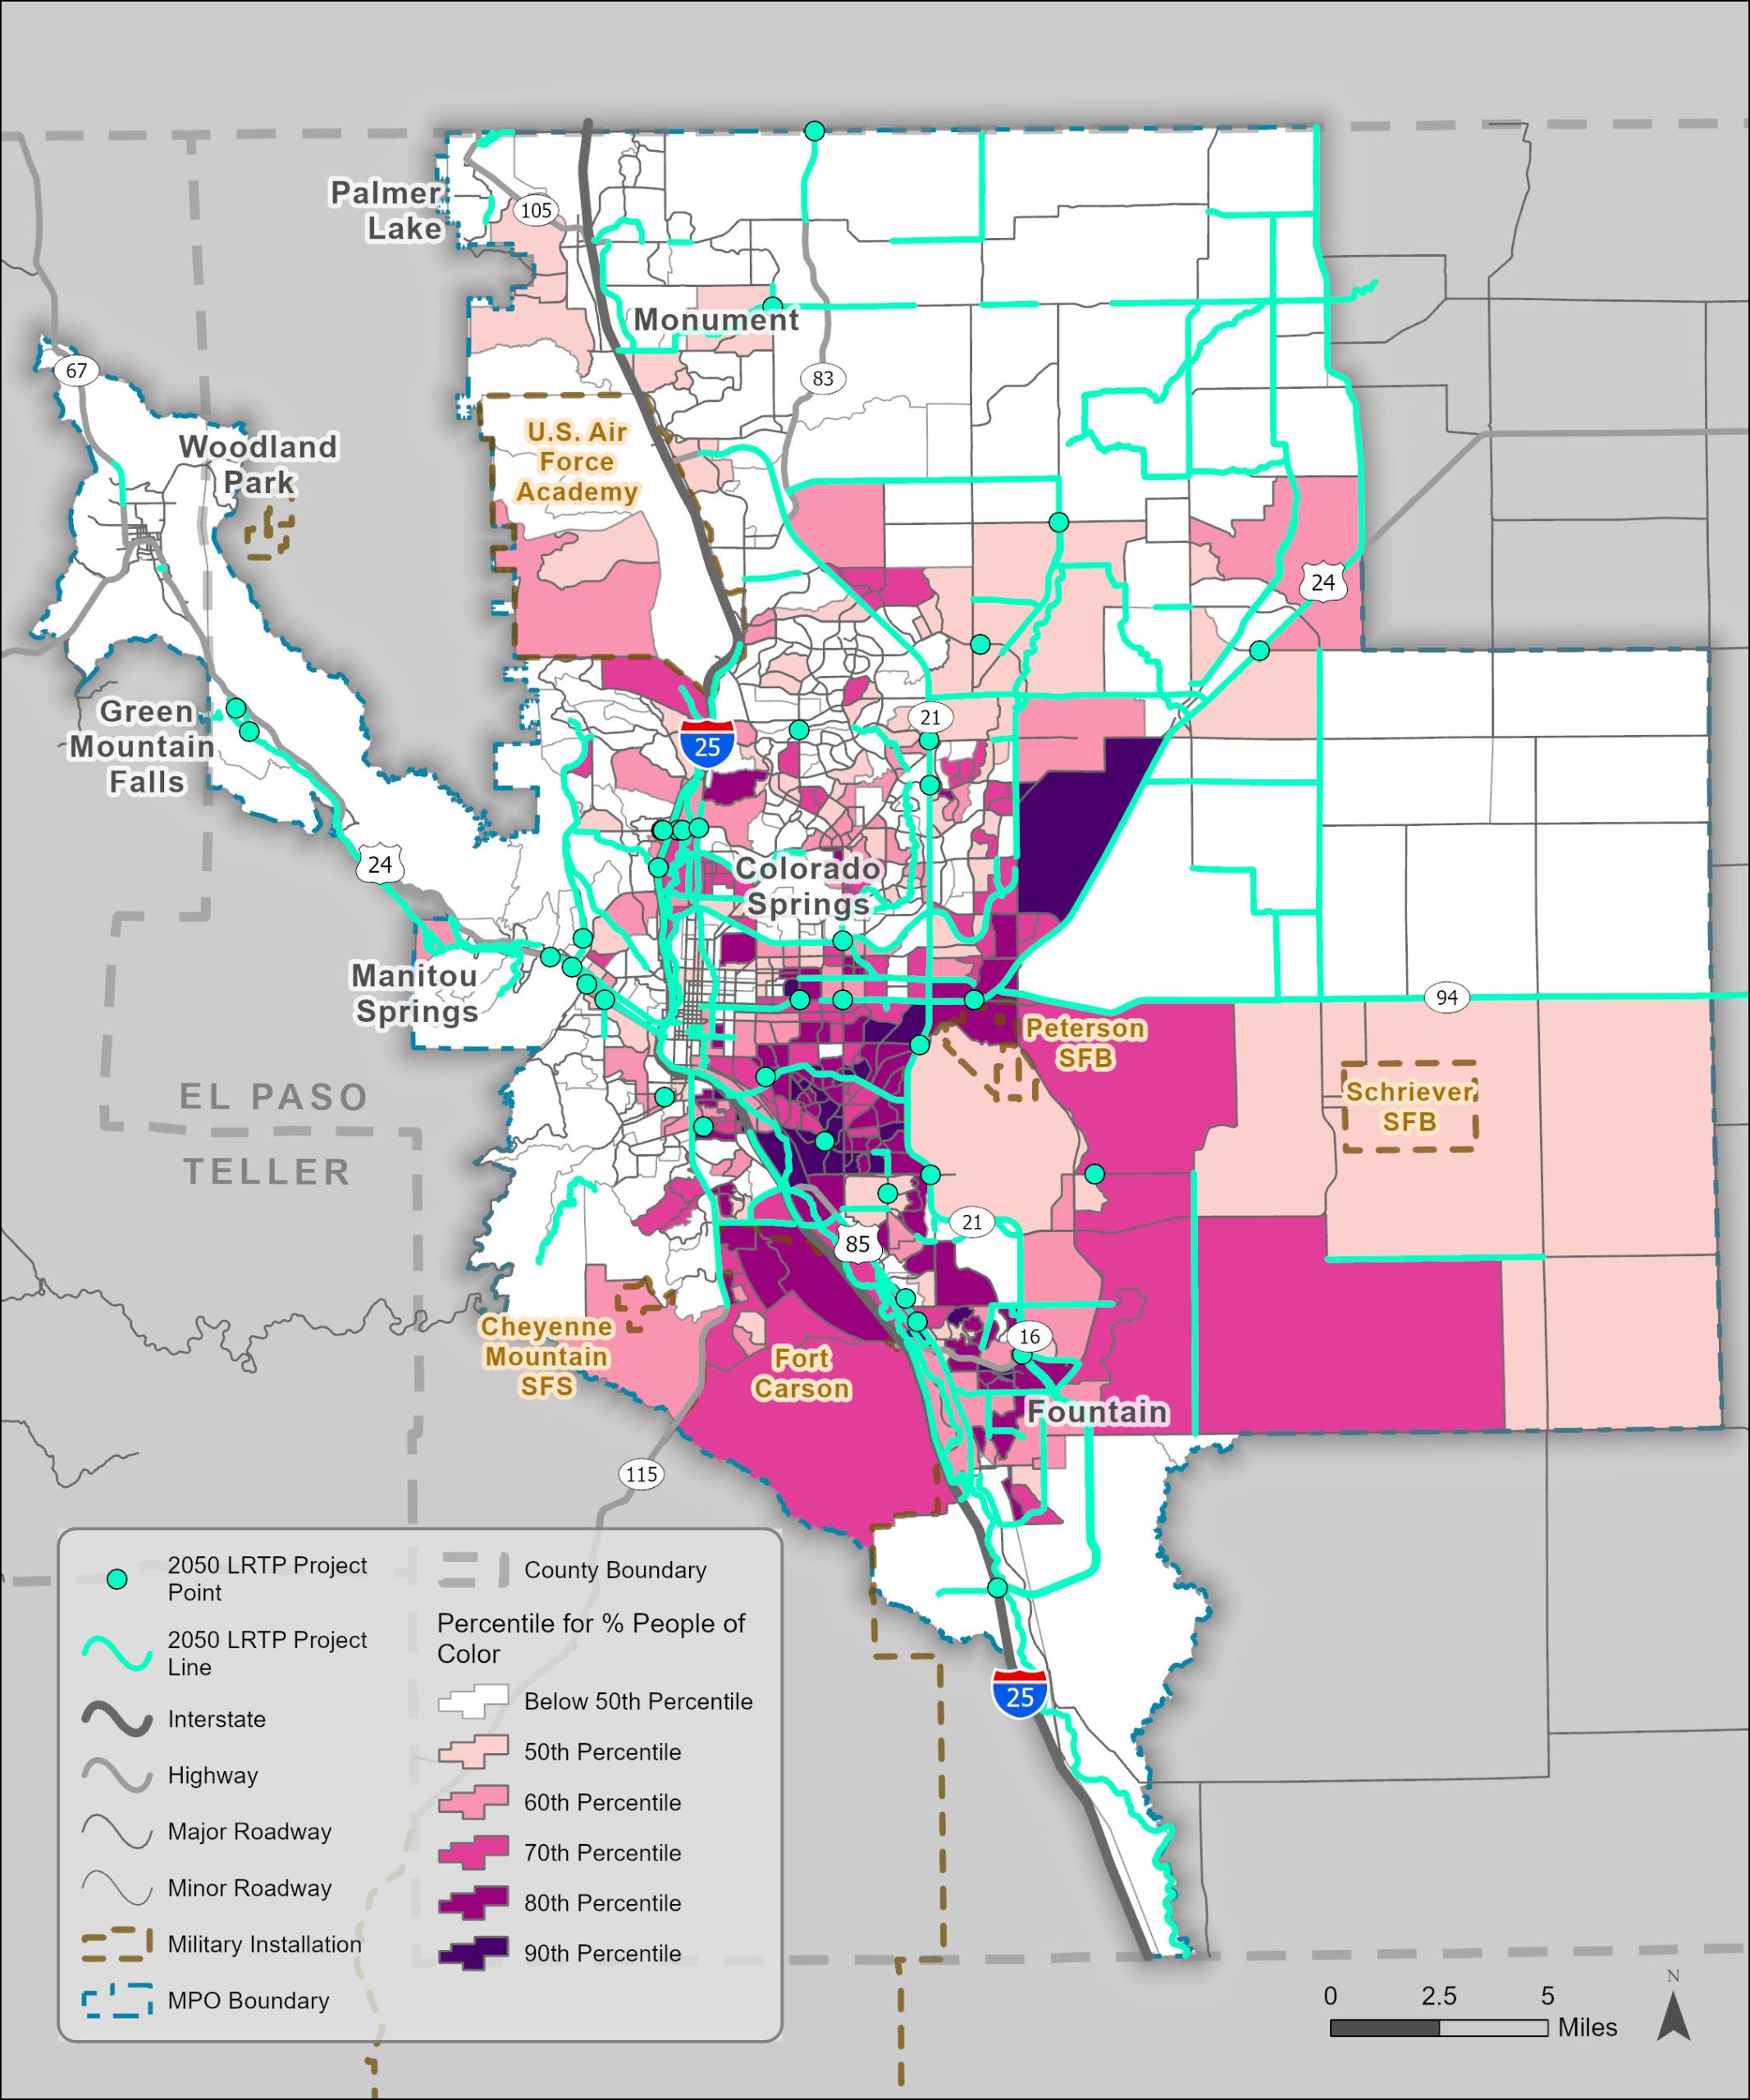
People of Color (POC) is defined as the percent of individuals in a block group who list their racial status as a race other than white alone and/or list their ethnicity as Hispanic or Latino. That is, all people other than non-Hispanic, white-alone individuals. The word “alone” in this case indicates that the person is of a single race, not multiracial. Figure E-1 depicts the fiscally constrained projects from the LRTP overlaid onto the mapped percentile of population that is POC.
The neighborhood southwest of Platte Avenue and Powers Boulevard is above the 90th percentile POC. This means that the percentage of POC within the Census block group score is greater than (or equal to) 90% of the state population.
There are a couple of LRTP projects that could have potential impacts on this area. The Platte Avenue Corridor Improvements project, between Chelton Road and Powers Boulevard, incorporates construction of a six-lane roadway that will include a shared use trail and connections to the existing Sand Creek Trail. This project will provide increased access to jobs, retail, and services as well as improved options for active transportation and alternative modes. However, the development of this project should include adequate evaluation to ensure there are no disproportionately adverse effects on nearby neighborhoods.
The Mobility/Safety Improvements SH 21, MM 132-154 project includes design funding for mobility or safety improvements along the corridor within the limits of mile markers (MM) 132-154. Impacts of this project include access to active transportation, trail connectivity, and increased safety.
There are several Census block groups off Platte Avenue with high percentile POC. The US24 Functionality and Routing Study – I-25 to Falcon project will conduct a major transportation corridor study to determine safety, traffic operations, transit operations, and functionality of US24. This project aims to increase safety and transit options for the people in this area.
The Fountain Creek Regional Trail in envisioned as a multi-use trail, that will begin at the El Pomar Youth Sports Complex in Colorado Springs and travel southward 24.9 miles through the City of Fountain to the El Paso/Pueblo County line. The LRTP Fountain Creek Regional Trail project will complete the southernmost 10.4 miles of trail and will constitute the last segment of the Colorado Front Range Trail through El Paso County Public Works. The trail will connect to two transit stops, one Park and Ride location, and three parks/open spaces. This project will increase access to transit and active transportation for many areas that have a larger percentile POC in the area.
Figure E-1: LRTP Projects compared with the Percentile of Population that is People of Color
Low-income
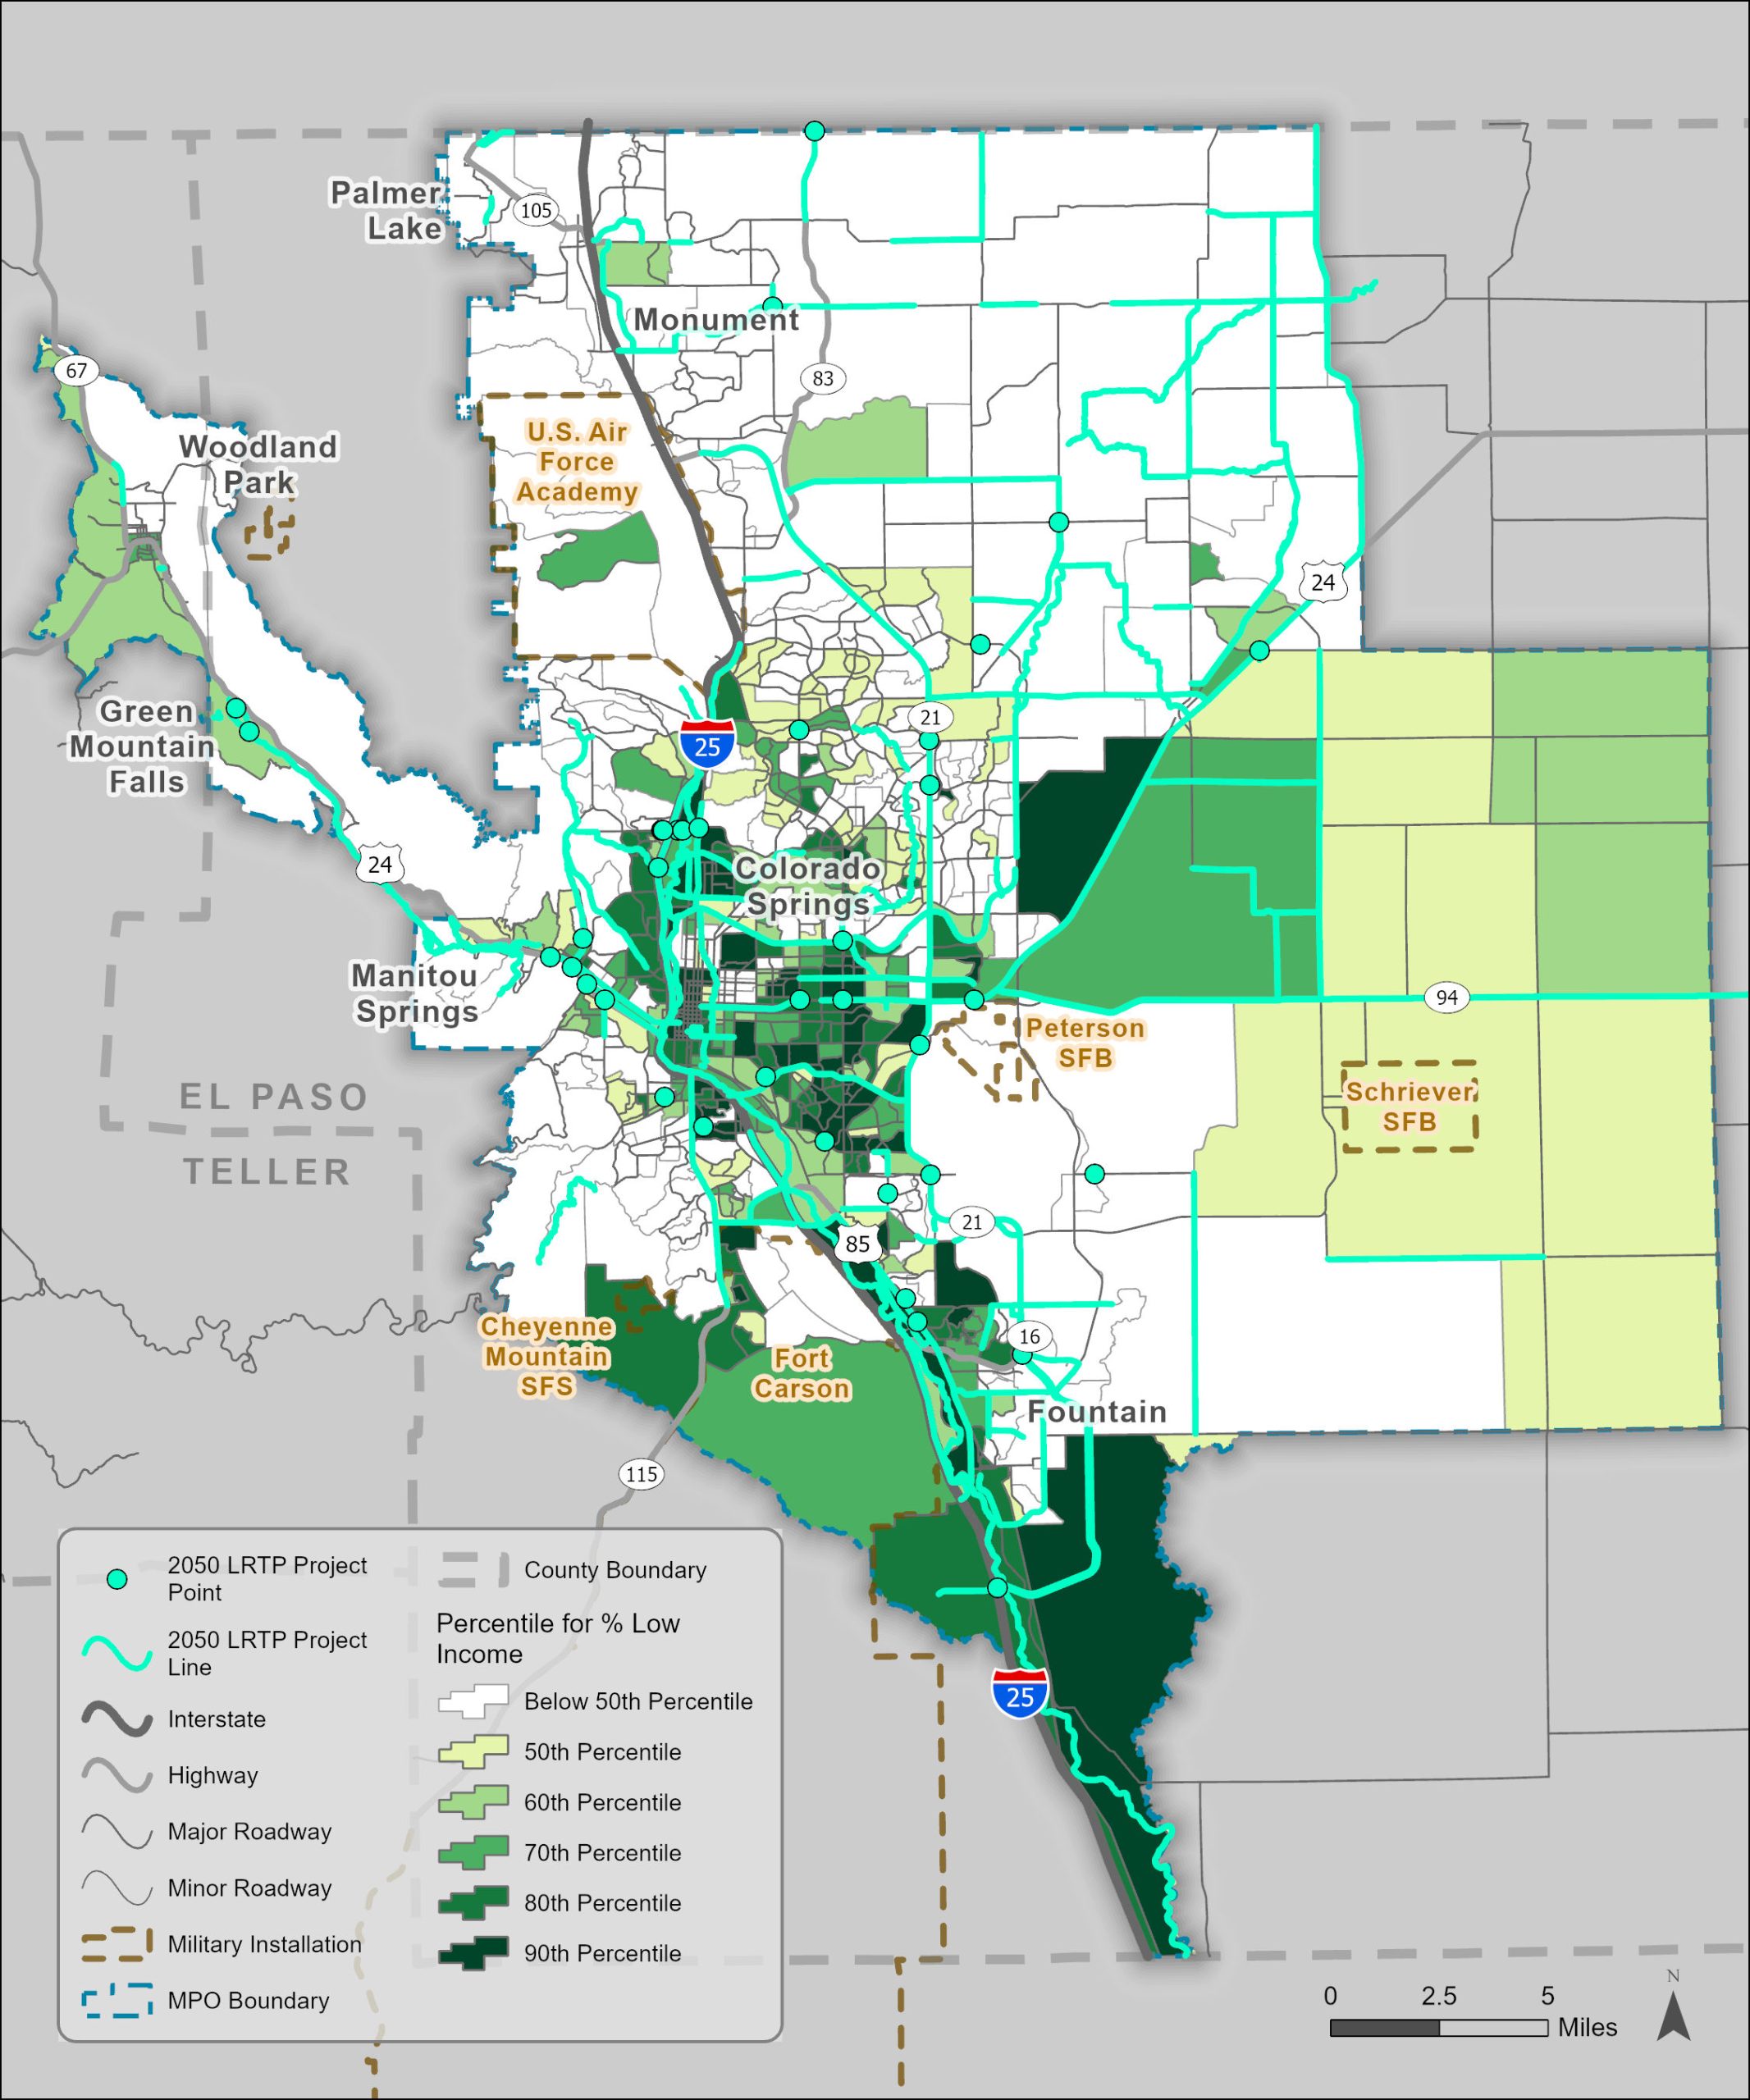
Low income is defined as the percent of a block group’s population in households where the household income is less than or equal to twice the federal “poverty level.” Figure E-2 depicts the fiscally constrained projects from the LRTP overlaid onto the mapped percentile of population that is low income.
The Pikes Peak Greenway Improvements Trail program will extend, realign, widen, and reconstruct/construct trails. It will also provide access to trails, connections to attractions or other portions of the trail network, crossings, wayfinding, ADA improvements and other functional enhancements. The project will run through many low-income areas above the 90th percentile, especially along the Nevada Avenue corridor.
The Templeton Gap Trail Improvements, Shooks Run Trail Improvements, and Fillmore Pedestrian Safety Improvements projects will provide active transportation access and increased safety to many low-income areas.
The area southeast of Fountain is a large block group in the 90th percentile for low income with two projects that could have potential impacts. The Powers Boulevard (SH21), South Extension to Rail Park project is for design, right-of-way acquisition, and construction of a two-lane arterial interim section of South Powers Boulevard (CO21) per an existing Planning and Environmental Linkages (PEL) study. This project is intended provide a critical redundant link to I-25 and reduce traffic on other area roads. It will also include multimodal, water quality, and safety elements. This road will serve freight traffic from Powers Boulevard, Colorado Springs Airport, and the freight distribution centers around the airport. This project will provide increased network security for the region as well as decreased congestion. It provides improved access for the population in this area but may also bring adverse affects of increased traffic such as health and safety concerns.
The other project in this area is the South Powers Trail. Commencing at Clear Spring Ranch, this 9.8-mile primary regional trail would travel northward along the planned South Powers Boulevard right-of-way corridor, ending at Powers Boulevard and Fontaine Boulevard where it would connect to a proposed extension of the Crews Gulch Regional Trail. This trail would thus allow for future connections to other primary and secondary regional trails in the area. This project increases opportunity for active transportation and recreation within the area.
Figure E-2: LRTP Projects compared with the Percentile of Population with Low Income
Over age 64
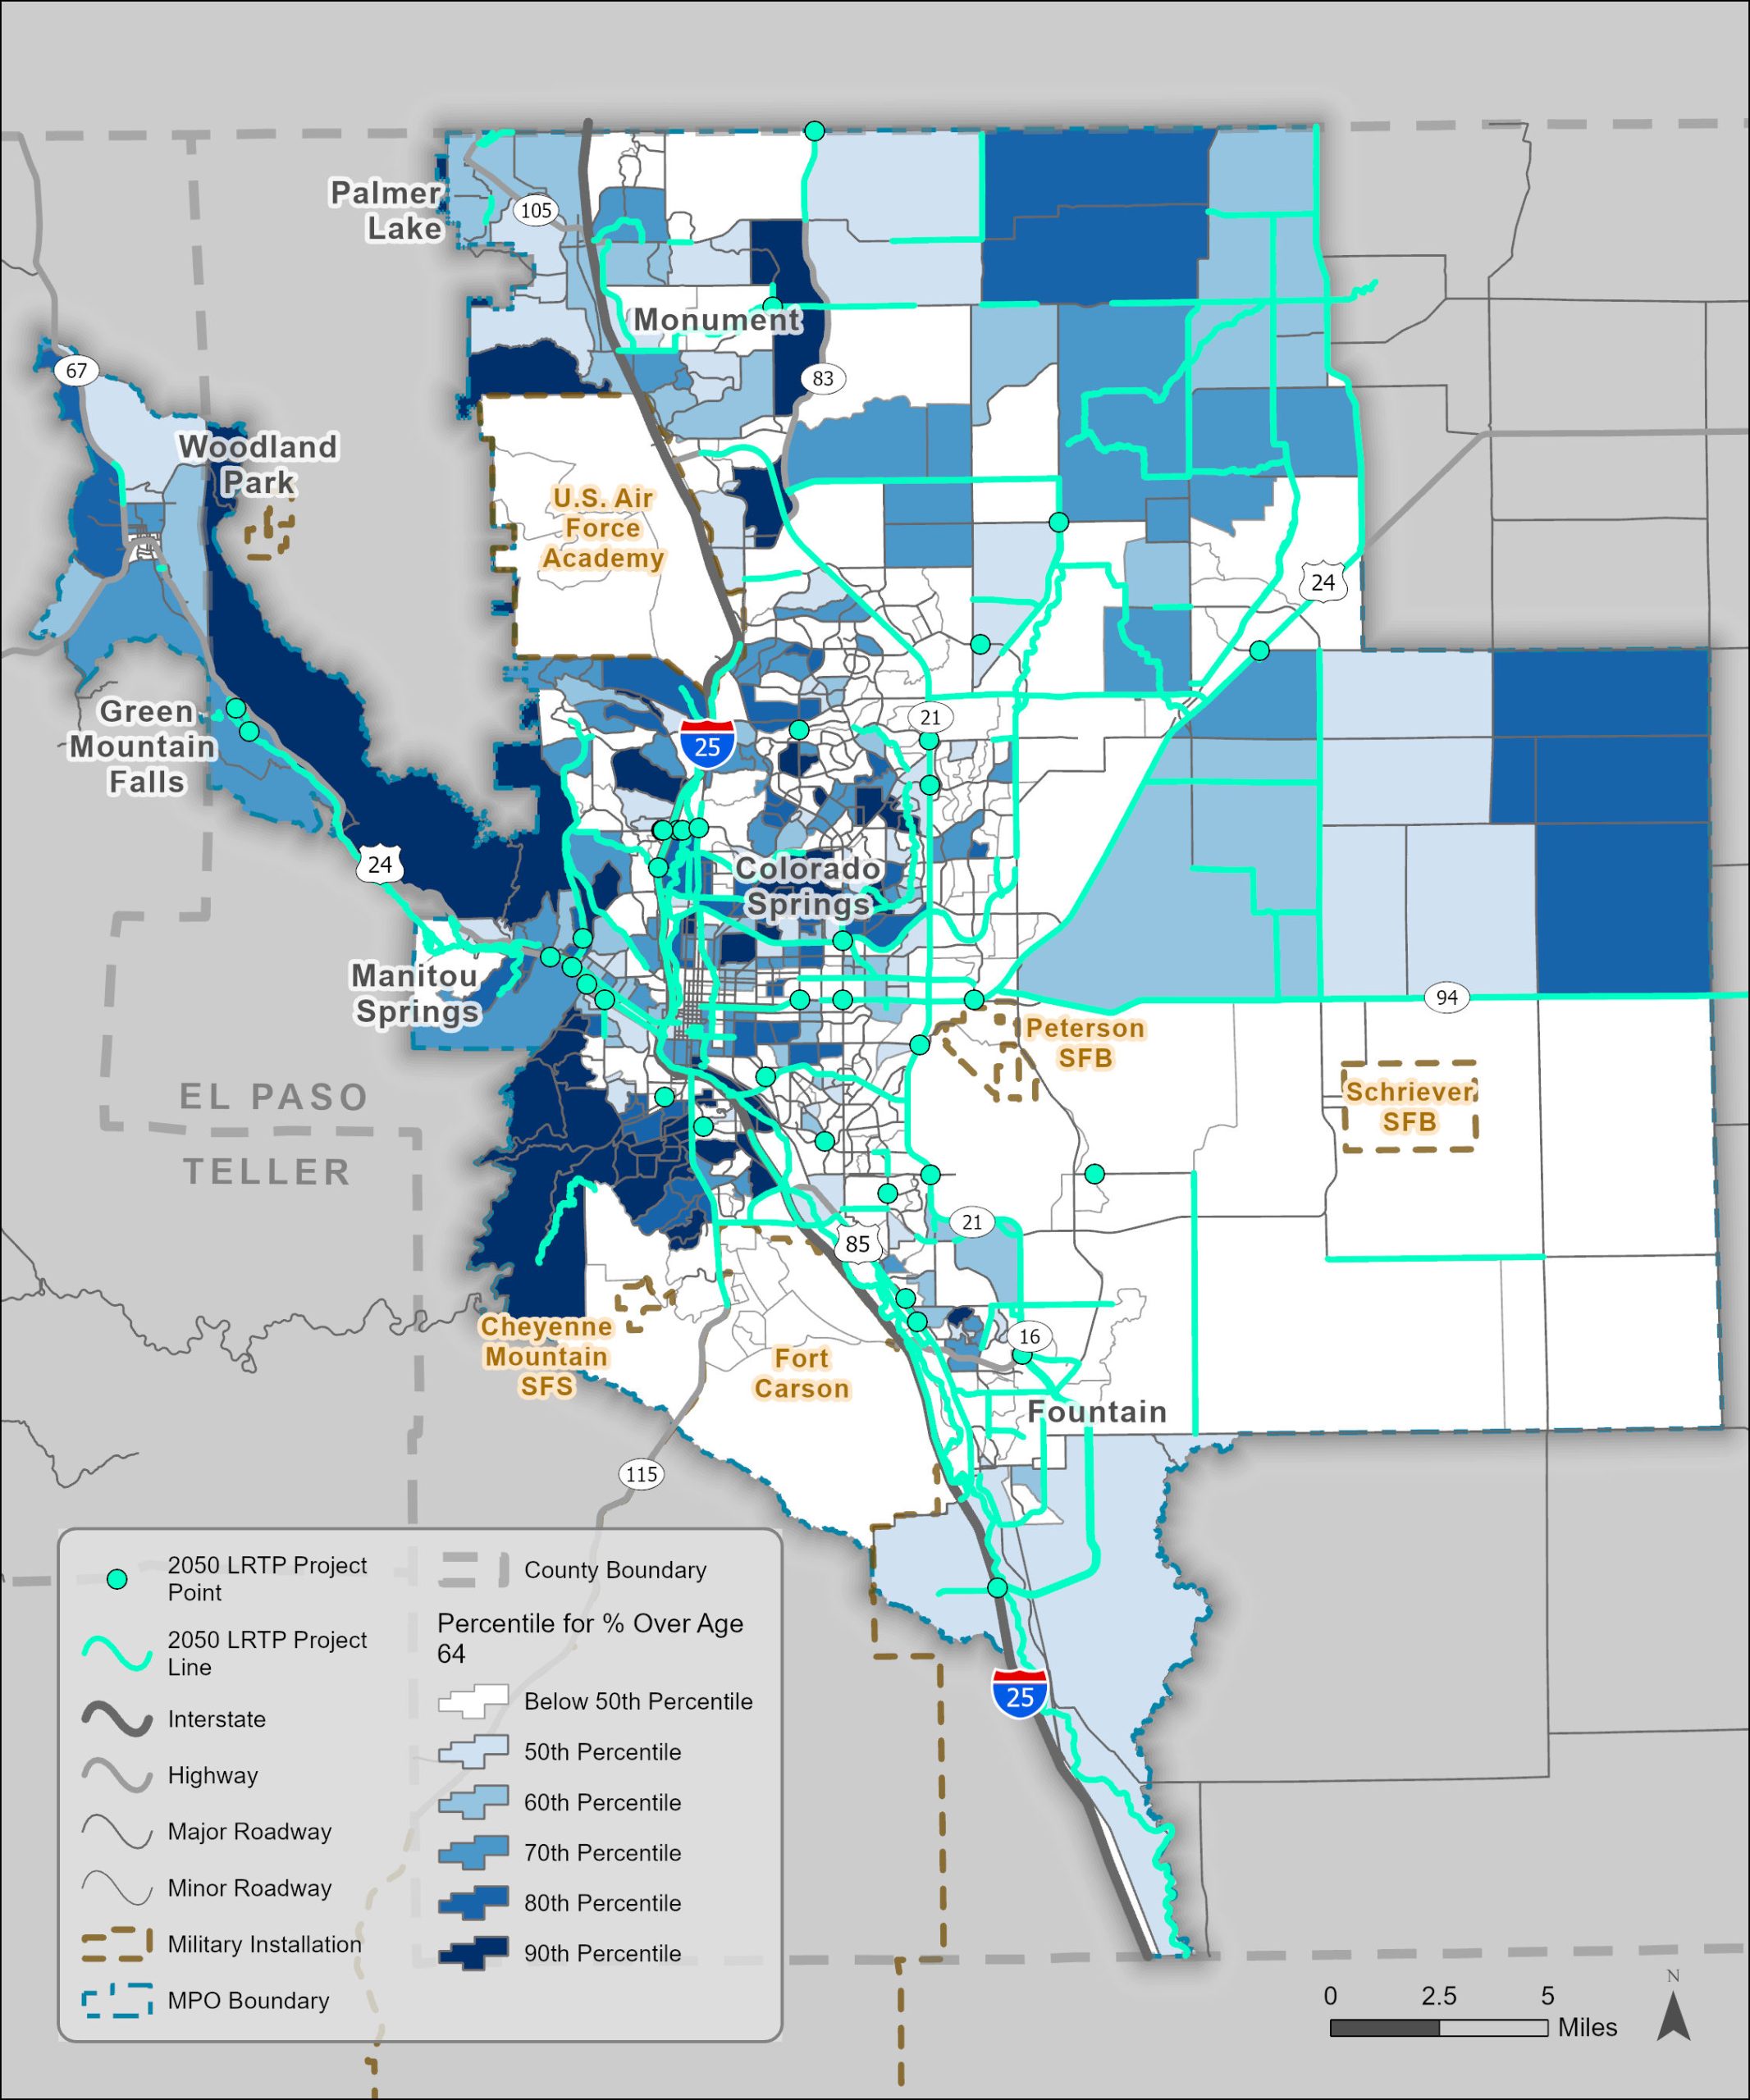
Figure E-3 depicts the fiscally constrained projects from the LRTP overlaid onto the mapped percentile of population that is over the age of 64. The LRTP projects that are planned to run through or near areas with high percentiles of people over the age of 64 are almost exclusively trail or transit projects. These will increase access to employment, services, goods, and recreation through a variety of transportation modes.
The Powers Boulevard Extension project, which runs from CO83 to Voyager Parkway, runs through the Flying Horse neighborhood, which has a high percentile of people over age 64. This will bring critical regional connectivity and redundancy to increase network security. However, it will also bring increased traffic that could also impact health and safety in the area. This project will be funded through the PPRTA and was approved by voters in the region.
Demographic Index
The Demographic Index is a combination of percent low-income and percent people of color. For each Census block group, these two numbers are simply averaged together. The formula is as follows: Demographic Index equals the sum of the % Low Income and the % People of Color) divided by 2.
For example, if a Census block group has a low-income indicator value of 25% and a people of color indicator value of 75%, the Demographic Index value would be 50%.
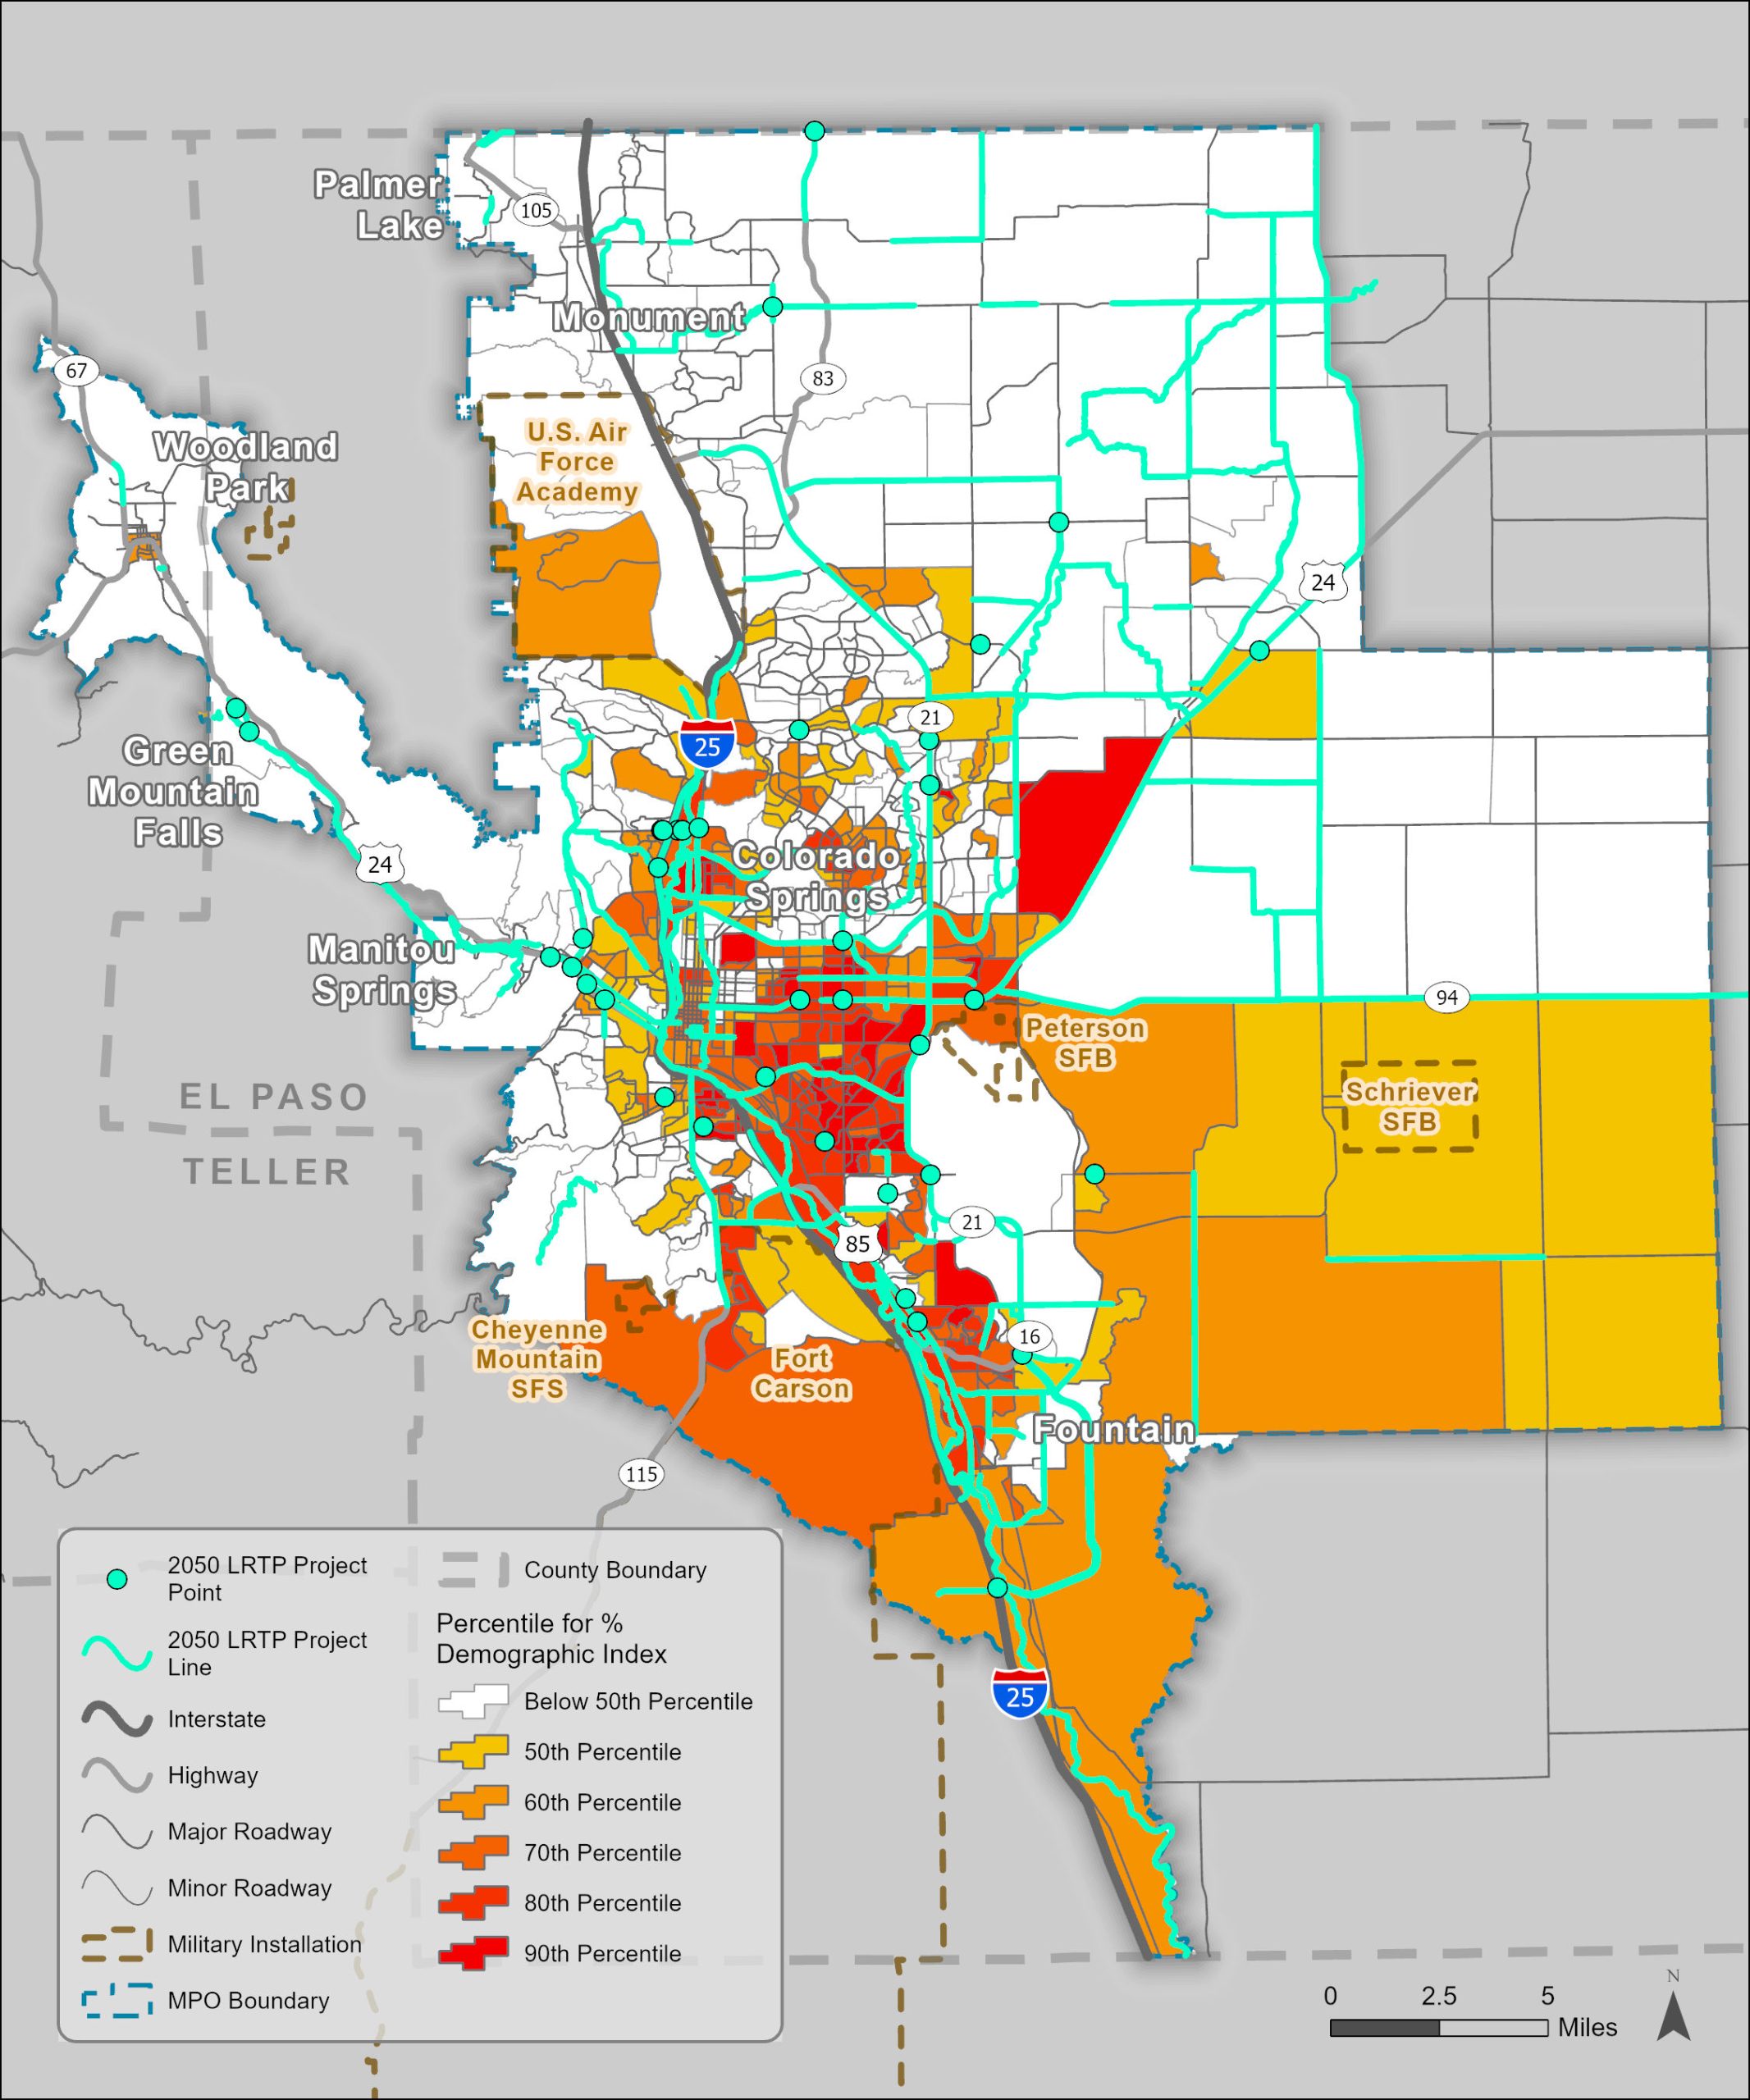
Table E-1 presents the percentages for race, ethnicity, and poverty status utilized to determine the Demographic Index. The data for race and ethnicity in the table below comes from the 2020 DEC Redistricting Data (PL 94-171) table from the U.S. Census Bureau. Figure E-4 depicts the fiscally constrained projects from the LRTP overlaid onto the mapped Demographic Index.
Table E-1: Race, Ethnicity, and Poverty Status in the Pikes Peak Region and State
| Demographic | El Paso County | Teller County | Colorado |
|---|---|---|---|
| White | 65.78% | 85.69% | 65.13% |
| Hispanic or Latino (of all races) | 17.80% | 7.10% | 21.88% |
| Black or African American | 5.58% | 0.51% | 3.83% |
| American Indian or Alaska Native | 0.52% | 0.68% | 0.58% |
| Asian/Pacific Islander | 3.34% | 0.62% | 3.54% |
| Some other race | 0.63% | 0.54% | 0.51% |
| Two or more races | 6.35% | 4.85% | 4.24% |
| Total Minority Population | 34.22% | 14.31% | 34.59% |
| Total Population | 730,395 | 17,390 | 5,773,714 |
| Poverty Rate | 9.60% | 9.20% | 9.70% |
Source: U.S. Cencus Bureau
Figure E-3: LRTP Projects compared with the Percentile of Population over age 64
The Shirley neighborhood, located between US-24 and Marksheffel Road, is in the 94th percentile for People of Color and 99th percentile for Low Income. One LRTP project could have potential impacts on this block group. The project would widen Marksheffel Road from Woodmen Road to North Carefree Circle. This would include enhanced bike and pedestrian accommodations for the length of the corridor and provide safe crossing opportunities at intersections. While this project provides increased access and improved safety, there are the potential health hazards that come with widening roads such as the potential for more traffic and higher speeds.
Per the demographic index, there is a concentrated area of low income and people of color located southeast of downtown Colorado Springs, between I-25 and Powers Boulevard. Two LRTP projects that could impact these populations that have already been discussed in this section: the Pikes Peak Greenway Improvements project and the Platte Avenue Corridor Improvements – Chelton to Powers project, and the US24 Functionality and Routing Study – I-25 to Falcon.
Overall Impacts
As a group, the 2050 projects have the potential to both help and hurt communities in the region. Much of the real effect will depend on how the projects are developed and whether any mitigation techniques are used. Communities will benefit from the many planned trail improvements and connections, transit projects, and safety improvements. Since rates of vehicle ownership and the costs of maintaining a vehicle in running order can be difficult for many people, transit improvements should be especially beneficial.
There are no any evident disproportionate impacts associated with the fiscally constrained projects in this LRTP. However, there are issues to consider regarding transportation planning, design, and construction. As discussed in Chapter 5, pollution; traffic volumes and speeds; access to work, schools, medical care, and stores; and access to safe physical activity are just some examples of these considerations.
Impacts to communities should be evaluated for each individual project through the planning, design, and construction process, including targeted outreach and engagement.
Figure E-4: LRTP Projects compared with the Demographic Index
At the regional level, the PPACG Title VI & Environmental Justice and Limited English Proficiency Plans include several provisions and recommendations for this type of proactive outreach and can act as guides moving forward. As LRTP and TIP documents are developed, public outreach techniques, community representative involvement, and tracking and reporting on improvements will provide crucial input regarding adverse affects and benefits of transportation projects.
In addition to this regional analysis, National Environmental Policy Act (NEPA) studies will need to be conducted for individual transportation projects that use federal funds. These studies need to incorporate analyses specific to those projects.