
Title
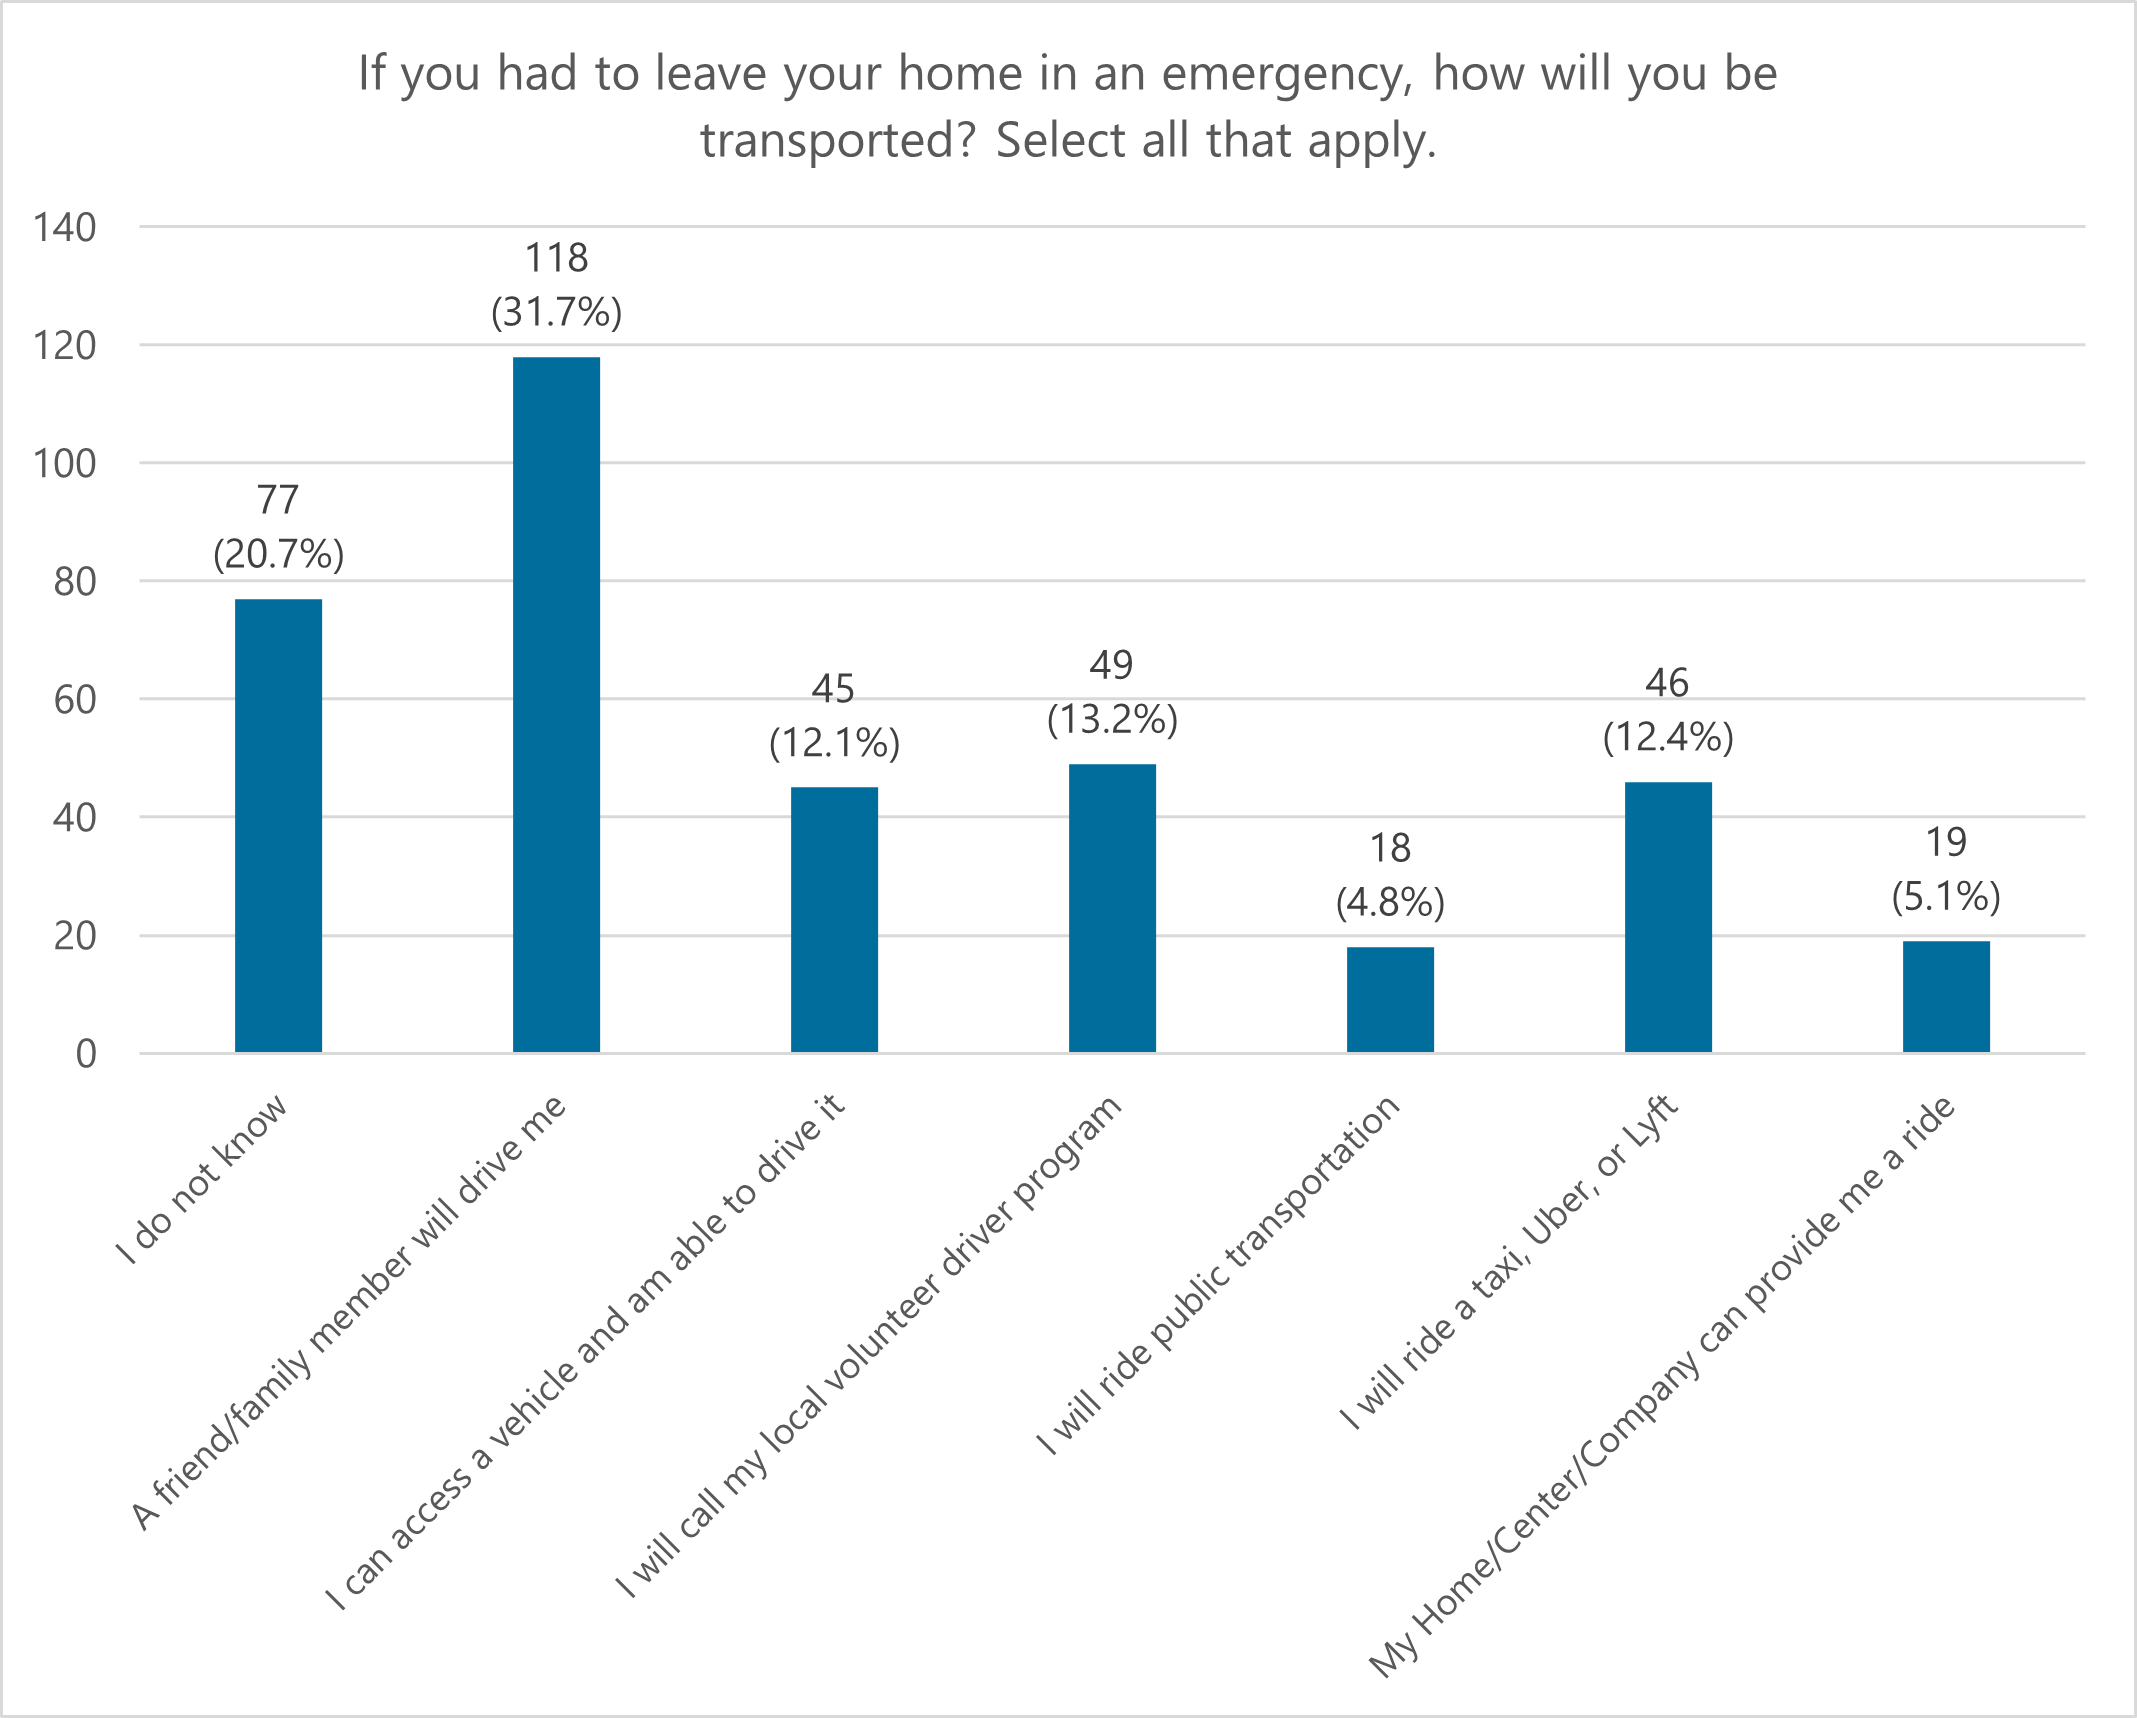
Bar Graph summary of PPAAA Survey Responses Regarding Emergency Transportation
Text on Map
If you had to leave your home in an emergency, how will you be transported? Select all that apply.
Each option listed is represented along the horizontal X-axis by a blue bar on the graph:
- I don’t know
- A friend/family member will drive me
- I can access a vehicle and am able to drive it
- I will call my local volunteer driver program
- I will ride public transportation
- I will ride a taxi, Uber, or Lyft
- My Home/Center/Company can provide a ride
The values on the Y-axis are numbers ranging from 0 to 140 with listed increments of 20:
- 0
- 20
- 40
- 60
- 80
- 100
- 120
- 140
Numeric values for each response:
- I do not know: 77 (20.7%)
- A friend/family member will drive me: 118 (31.7%)
- I can access a vehicle and am able to drive it: 45 (12.1%)
- I will call my local volunteer driver program: 49 (13.2%)
- I will ride public transportation: 18 (4.8%)
- I will ride a taxi, Uber, or Lyft: 46 (12.4%)
- My Home/Center/Company can provide a ride: 19 (5.1%)