
Summary
Population growth, economic expansion, and urbanization drive increasing demand for transportation facilities and services. This chapter explores the forecasted changes in land use and socioeconomic factors that are expected to impact the Pikes Peak Region’s transportation system.
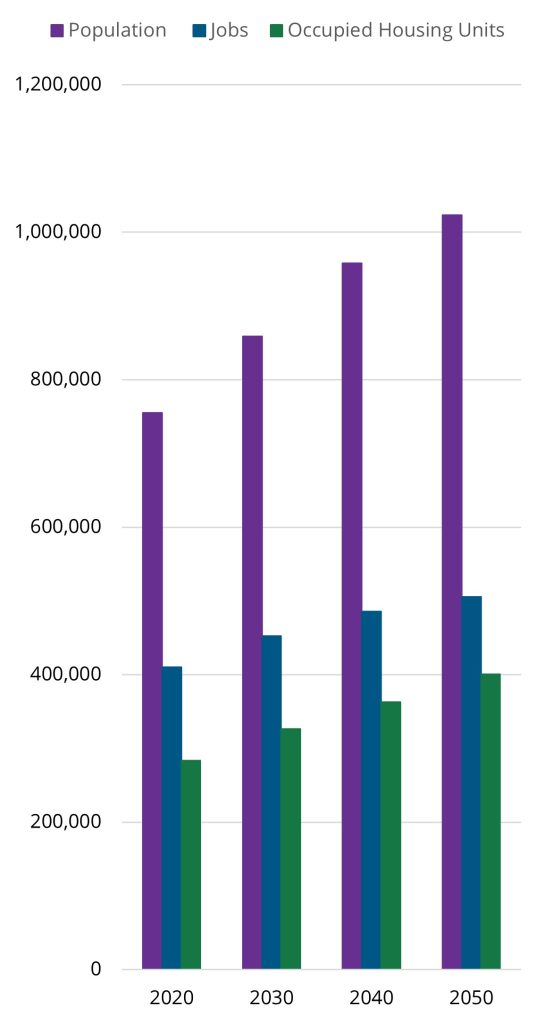
PPACG uses forecasts from the Colorado State Demography Office, which is housed within the Department of Local Affairs (DOLA), to help develop the area’s socioeconomic trends. By 2050, the region is projected to be home to over 1,023,000 people, growing by about 268,000 from the 2020 Census population of 755,105. The State Demographer also forecasts regional employment to grow by more than 95,000 new jobs over that same time period, while the number of occupied housing units is expected to increase from 283,470 in 2020 to 400,923 in 2050. Figure 6-1 shows the population, job, and housing unit growth anticipated from 2020-2050.
Figure 6-1: Population, Job, and Housing Unit Growth 2020-2050
More people and jobs mean more trips to and from work, school, shopping, appointments, and recreation, increasing demand on the transportation network.
Proactive planning can help mitigate these potential transportation challenges. PPACG collaborates with local government and military planners in the region to develop comprehensive assessments of residential and commercial growth, projecting where the forecasted population will live and work so that transportation investments can better accommodate and even help mitigate the impacts of these changes.
Methodology
Overview
PPACG worked with its local government members, particularly planners from Colorado Springs and El Paso County, to evaluate the strengths and weaknesses of the land use forecast developed for the previous 2045 LRTP, which was adopted in 2020. A primary concern was the forecast’s overemphasis on population growth in two major planned developments, which understated the potential impact of urban infill initiatives and affordable housing projects in other areas of the MPO. In agreement with these concerns, PPACG committed to adopting a new approach for the land use forecast in the 2050 LRTP.
For the 2050 LRTP model, PPACG moved away from independent forecasting using tools and adopted a more collaborative approach, creating a regional “best-fit” model from all the development plans of its member governments. The process allowed known developments and entitlements to be accounted for in the regional land use forecast alongside the use of historical data like accessory dwelling unit (ADU) permits and residential build rates. When growth scenarios from multiple jurisdictions ended up exceeding the population control totals, roundtable discussions were held to evaluate where growth might be tempered based on historical trends, current and expected development incentives, and utilities requirements.
Transportation Analysis Zones
To project future needs and confirm that the 2050 LRTP transportation projects will be consistent with anticipated growth patterns, PPACG models population and employment in small areas that share similar land use and access to the transportation network, known as TAZs. There are 934 TAZs in the Colorado Springs MSA, which includes all of El Paso and Teller counties.
Each TAZ is typically derived from a Census Block Group, edited to be coincident with parcel boundaries, and then split or merged as needed to best represent shared network access and homogeneous residential, commercial, or military areas. This effort ensures that zones can effectively represent neighboring subdivisions that utilize different streets as points of entry and exit and also ensures that primarily residential areas can be accurately associated with Census data such as demographics and household income, while commercial zones can accurately represent the number and type of jobs in the area. Figure 6-2 shows the TAZs symbolized according to the relative percentage of residential and commercial area in each zone.
Figure 6-2: 2020 Ratio Residential/Commercial Areas by TAZ

TAZs are critical for travel demand modeling, as they are used to determine the origins and destinations of trips along the regional transportation network. PPACG used data from the 2020 Census, State Demography Office, Bureau of Labor and Statistics, County Assessor offices, private firms like DataAxle, and more to establish a base year model of population and employment data for each TAZ. This base year model serves to both help calibrate the travel demand model by verifying the trips to and from each zone align with the population and employment factors expected to produce such trips, and also establish the baseline upon which the land use and socioeconomic forecast is built.
Control Totals
A critical initial step for generating a land use and socioeconomic forecast is to determine the region’s control totals, which serve as the limits for the total number of people and jobs throughout the planning region in each forecast year. Control totals are important for the planning process to ensure that no single local input or regional entity can influence the projected growth beyond what is expected by an independent measure. PPACG consulted with the Colorado State Demography Office to establish the 2050 LRTP control totals using their impartial and meticulously developed population and employment estimates for all of El Paso and Teller counties in each forecast year.
With the total population and employment limits set, the core component of the planning process begins – determining where the population and employment changes are going to occur, at what rate, and how those changes might impact expected socioeconomic factors such as age distribution, household size, incomes, and ultimately, travel patterns.
Growth and Development Plans
PPACG met with local government planners to review the base year model and collaborate on developing a comprehensive “best-fit” growth and development forecast that faithfully represented each jurisdiction’s own plans while adhering to the state’s control totals for the region as a whole.
Development plans, entitlements, and zoning information was compiled from each jurisdiction, and then evaluated against natural and regulatory constraints to determine an approximate developable area for each applicable TAZ. Areas within a TAZ that are not developable or relatively difficult to develop, due to natural hazards such as flood zones or steep slopes, were accounted for in addition to ownership constraints such as military influence areas and land owned by the State Land Board, National Park Service, U.S. Forest Service, and others. The result is an effective appraisal of actual developable space within each TAZ that coincides with a jurisdiction’s development plans. Combined with zoning information and housing density estimates from the development plan, the number and type of housing or commercial facilities can be forecasted for the TAZ.
Annual housing growth was limited to not exceed typical build rates in the area. Peak build rates are around 195 single family housing units per year, as seen in fast growing developments like the Wolf Ranch neighborhood in northeast Colorado Springs. Single family build rates are typically much lower in more rural TAZs. High density housing, such as townhome communities and commercial apartment developments, can result in an average build rate of several hundred units a year when multiple projects are planned in the same TAZ.
After development was allocated, the forecasted population was determined using an average persons per household estimate derived from Census data. For example, if a development in a TAZ is expected to have 300 homes when fully built out, and the Census estimates 2.5 persons per household for that area, then 750 people are expected to be added to the TAZ when the development project is complete. If that project is expected to take 5 years to complete, then the population growth rate is 150 people per year.
The socioeconomic data in the land use forecast, such as household income and age distribution, was developed using extrapolated patterns from Census and State Demographer data applied to the new population in each TAZ. School enrollment was modeled from existing admission rates and applied to the new schools constructed as part of residential development plans.
Employment was primarily forecasted using floor area ratios and space utilization rates from the U.S. Energy Information Administration. As an example of the process, consider a large commercial development that entails 250 acres in the plan. PPACG staff, working with the applicable jurisdiction, determines only 200 acres are actually developable based on restraints of slope and easements. If half the project is expected to be office space, and the other half retail, a typical floor area ratio for those commercial types is 0.28, and multiplied by 200 buildable acres, results in an estimated 1.2 million square feet of floor space expected for each business type. An average utilization rate for office buildings is 600 square feet per employee, and 920 square feet per employee for retail buildings. In this example, the commercial project would produce an estimated 2,000 office jobs and 1,300 retail jobs.
Construction jobs were tied to development, using estimates from the National Association of Homebuilders and the Bureau of Labor Statistics to forecast the labor employment required to support forecasted residential and commercial build rates.
Planning Intervals
PPACG held multiple meetings with local planners and organizations to review the development projects included in the forecast, and then reach consensus on growth distributions and build rates for each 10-year planning interval.
The population growth rates from development were evaluated in conjunction with a naturally declining population, as determined by the State Demographer’s assessment of declining birth rates in the region, to establish a land use forecast that did not exceed control totals. If multiple projects were expected to produce population growth that exceeded the control total for a given forecast year, then build rates were adjusted as necessary. Commercial development was likewise evaluated collaboratively by PPACG and local planners for each 10-year planning interval to produce employment distributions and job growth rates that aligned with expected development patterns out to 2050.
PPACG took current growth patterns and development plans into account and assigned growth based on these inputs. It is important to note that the growth that was assigned is a snapshot in time, based on plans and information that were available at the time of the land use modeling.
After development was allocated, PPACG met with local planners and organizations to ensure support for the growth distributions. As previously noted, PPACG’s growth forecast expects 505,629 jobs and 1,023,259 people by 2050, while not exceeding the control totals. The population control totals are compared with the PPACG projected totals in Table 6-1.
Table 6-1: Population Control Totals vs. PPACG Population Totals
| Year | Control Population | PPACG Population |
|---|---|---|
| 2020 | 757,111 | 755,105 |
| 2030 | 859,427 | 858,962 |
| 2040 | 958,942 | 958,237 |
| 2050 | 1,023,342 | 1,023,259 |
The socioeconomic data is developed in 10-year intervals to align with banding of projects to be modeled. These 10-year bands are needed so that projects can be built when sufficient funding is available.
The proposed projects, along with the land use forecasts, are modeled for travel time and the State of Colorado required GHG performance.
While the LRTP is a 25-year plan beginning in 2025, PPACG uses 2020 as a base year for the 2050 LRTP. The 2020 Census data was the last collection of data by the U.S. Census Bureau. By using the 2020 data as a base year, it provides a more realistic look at the socioeconomic data to better forecast the future 10-year bands.
Land Use Forecast
Population
The forecasted population change by TAZ from 2020 through 2050 and the forecasted total 2050 population by TAZ were mapped and are depicted in Figures 6-3 and 6-4.
Figure 6-3: 2020-2050 Population Changes by TAZ

Figure 6-4: 2050 Total Population by TAZ
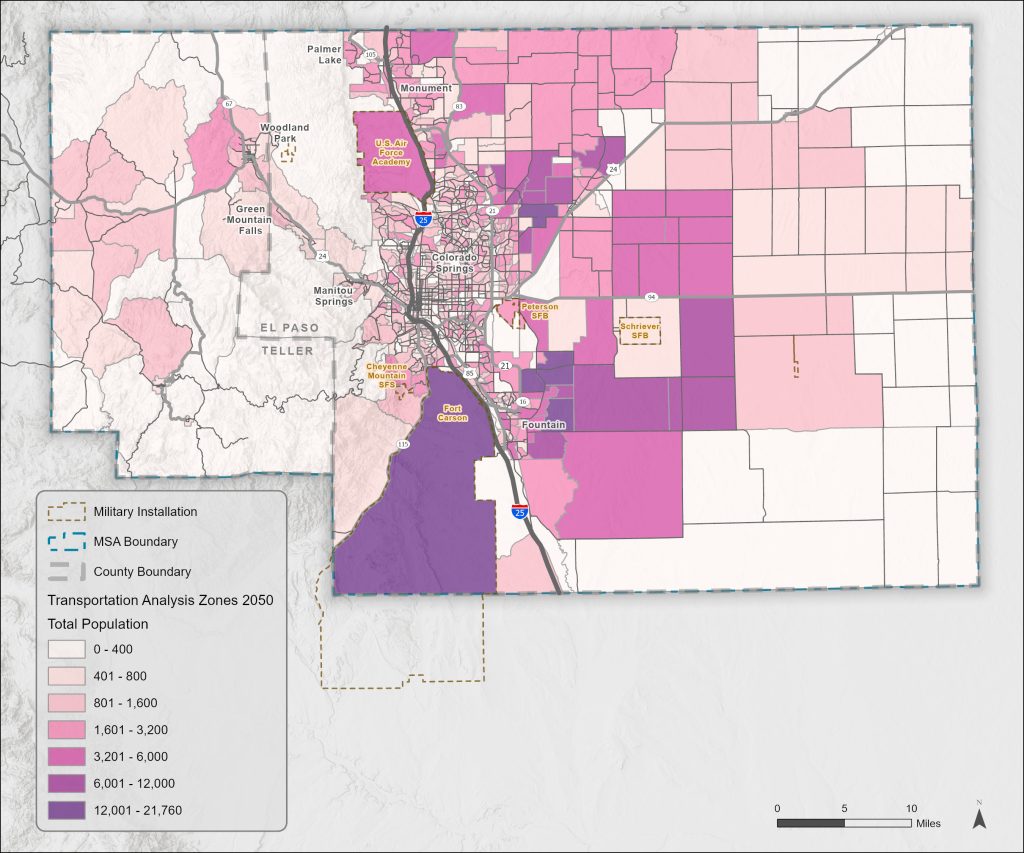
The areas of greatest growth occur mainly east of Powers Boulevard (CO21) in Colorado Springs and around the City of Fountain. Development in North and South Banning Lewis Ranch is expected to see rapid growth. This map also depicts an increase in development around Peterson SFB.
It should be noted that areas of high and low growth do not always correlate with overall high or low population. Rather, Figure 6-4 shows the forecasted total population for each zone in 2050. The TAZs representing Fort Carson, North Banning Lewis Ranch, and the area south of Peterson SFB and east of Fountain are among the most populated.
Age Brackets
Figure 6-5 depicts the net migration by age to Colorado Springs from 2010 through 2020 as developed by the State Demography Office. Growth patterns slowed significantly during the covid-19 pandemic. Though the rates of population and job growth have been declining compared to those prior to 2020, there is still an influx of people and jobs coming into the area. The largest group of people in-migrating to the Pikes Peak Region are those in the 25-35 age bracket. The region attracts this age group likely because of the large military presence, universities, and early career opportunities in the region. It is also an attractive area for young families.
Figure 6-5: Net Migration by Age 2010-2020

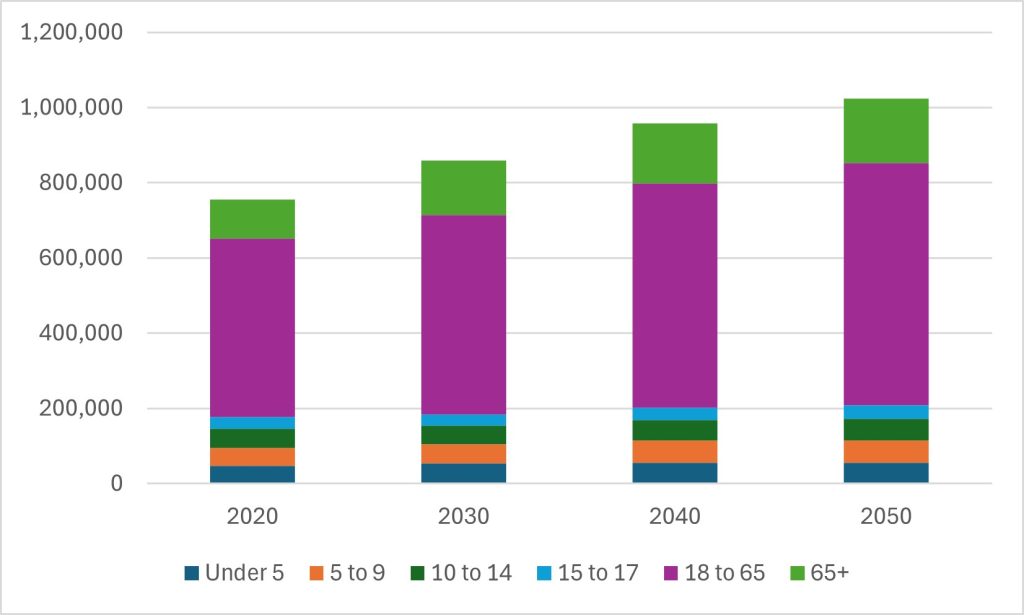
There was a large boom of in-migration in the early 1990s of people in the 25-35 age range. Much of that population is now aging in place. For this reason, the largest share of growth in the region presently is among those age 65 and above. Figure 6-6 depicts the population by age bracket for 2020, 2030, 2040, and 2050.
Figure 6-6: Age Brackets 2020-2050
Residential Units/Housing
The majority of TAZs throughout the region have seen major residential housing growth in the past decade. Single-family housing will continue to make up the majority of housing units in the Pikes Peak Region. There were 200,632 single-family dwellings in 2020, and by 2050 there are expected to be 275,795 single-family homes.
Table 6-2: Population Control Totals vs. PPACG Population Totals
| Year | Single Family Units | Multi-Family Units |
|---|---|---|
| 2020 | 200,632 | 93,785 |
| 2030 | 222,545 | 113,387 |
| 2040 | 247,990 | 126,852 |
| 2050 | 275,795 | 139,371 |
Meanwhile there were 93,785 multi-family units in the MSA in 2021. By 2050 there are expected to be 139,371 multi-family units. In this case, multi-family refers to the number of units and includes condos, duplexes, apartments, senior living facilities, and ADUs. College dorms, jails, juvenile facilities, and barracks are not included in the multi-family numbers.
Figure 6-7 depicts new home construction between 2011 and 2023. The largest areas of recent growth in new residential units is anticipated in northeastern Colorado Springs, west of downtown Colorado Springs along US24, and northeast of Fountain. This map includes single-family and multi-family units such as duplexes or townhomes that are purchased by the resident. It does not include apartments, senior living centers, or other commercially managed rental units.
Figure 6-7: New Home Construction 2011-2023
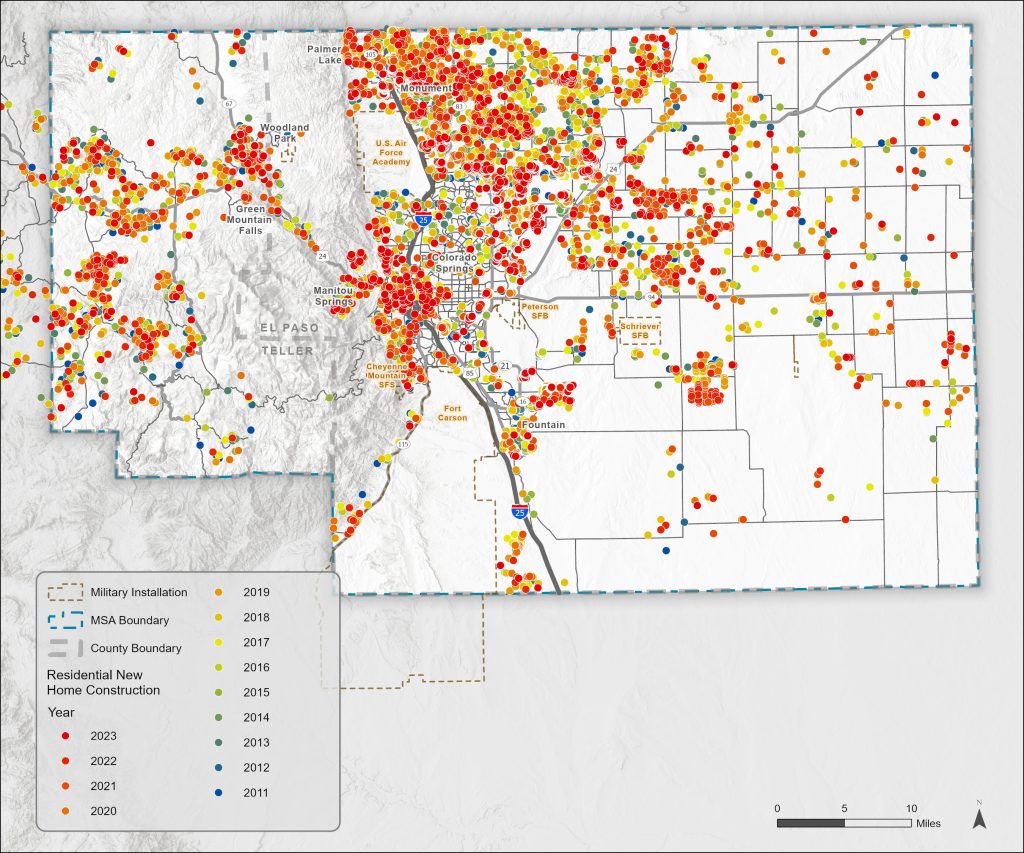
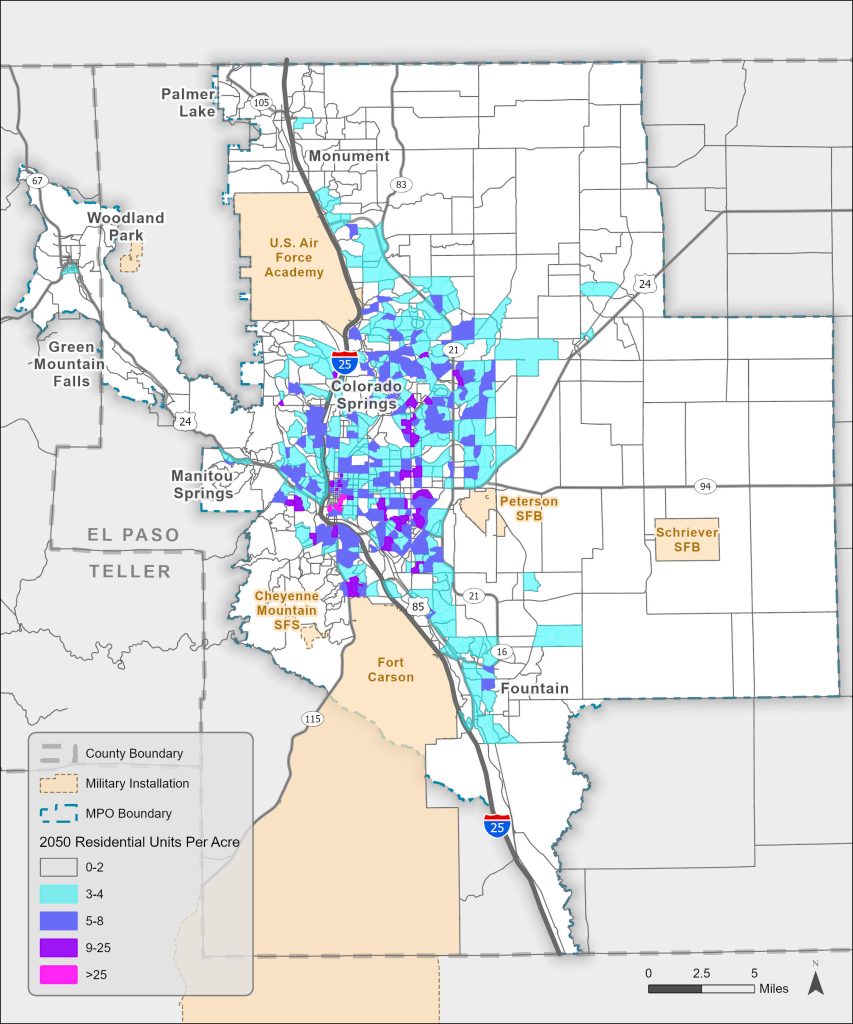
Figure 6-8 depicts the number of residential units per acre projected for 2050. Housing density varies across the Pikes Peak Region. For the 2050 estimates, housing density is highest in a few TAZs located in downtown Colorado Springs. Other high density areas are mostly located along the Academy Boulevard corridor in Colorado Springs, where there is a high percentage of multi-family units. Housing density decreases farther from urban centers. In 2050 it is estimated that the average density will be about 2.72 housing units per acre in the MSA, up from 2.23 in 2020.
Figure 6-8: Residential Units per Acre 2050
Housing Affordability
Housing affordability in the Pikes Peak Region is low due to high housing prices, rising interest rates, and a housing deficit. As of February 2024, the average price of a home in Colorado Springs had increased 119% from 2015 to $449,123, while mortgage and interest rates have increased 82.6% over the same period. In the fourth quarter of 2023, the average apartment rent was $1,456 per month.
There are several initiatives in the region aimed at improving housing affordability, access, and production. The region should strive to support land use decisions and projects that provide a variety of housing types and sizes, serving a range of demographic sectors, and meet the needs of residents and families through various life stages and income levels. For example, working families may need larger apartments near schools, employment, and transit, or low income seniors may want housing with age-in-place features and outdoor access.
Jobs
It is anticipated that, like the population, jobs will grow in the region. Figure 6-9 depicts the anticipated job changes by TAZ from 2020 through 2050. The largest increase in jobs is anticipated along the Powers Boulevard (CO21) corridor, with a significant amount of the employment along this corridor being labor to support new development taking place.
Figure 6-9: 2020-2050 Total Job Changes by TAZ
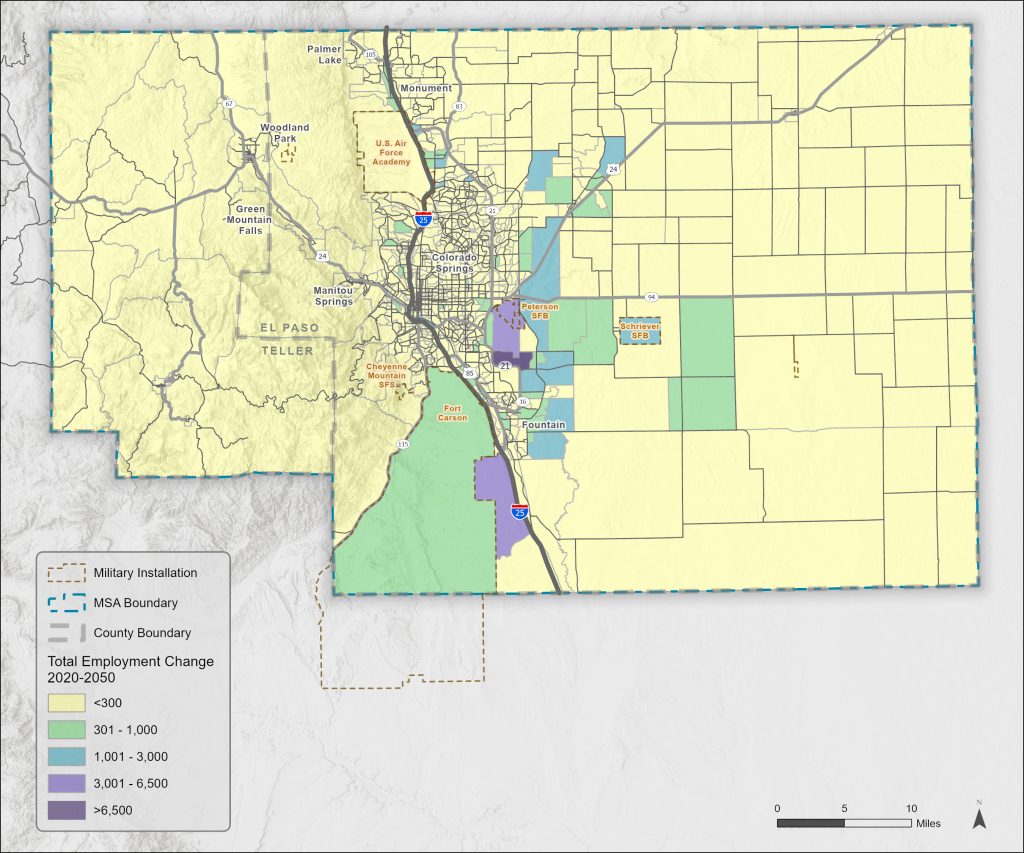
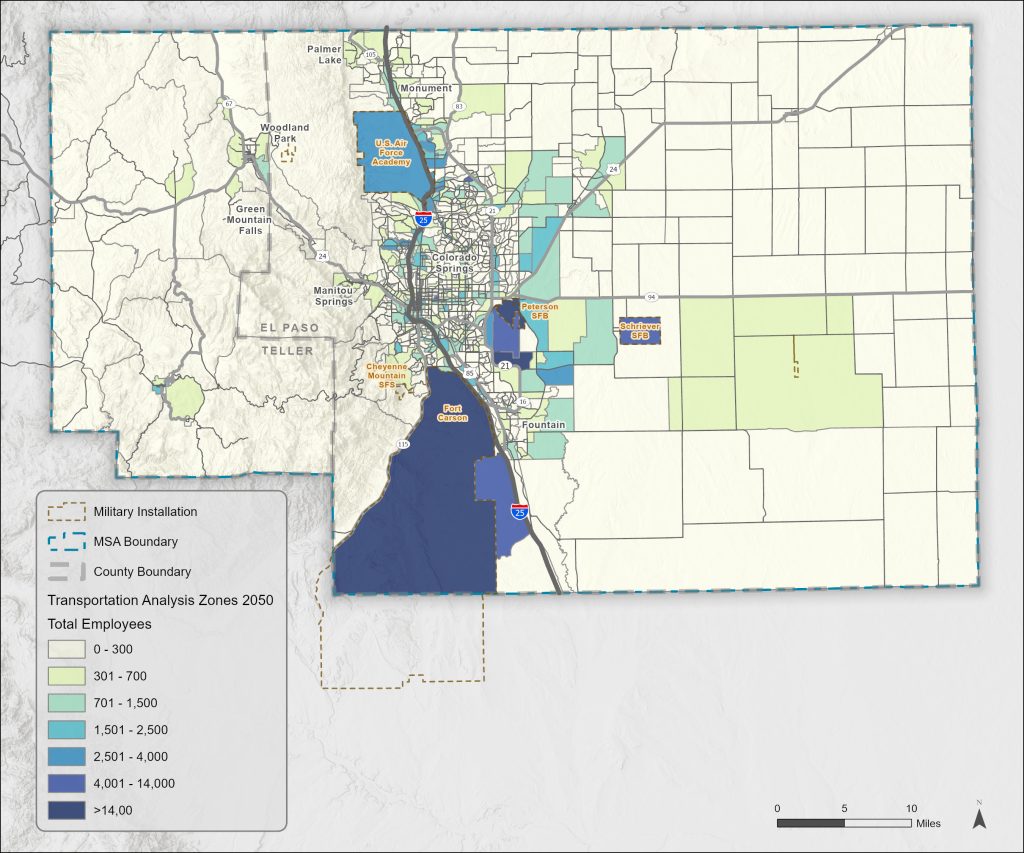
Figure 6-10 depicts the number of jobs by TAZ anticipated in 2050. The TAZs with the largest number of jobs are projected to be the military installations along with a new employment center called Peak Innovation Park. This is located near the Amazon distribution center just south of the Colorado Springs Municipal Airport. This employment center could encompass over 30,000 jobs at full build-out.
Figure 6-10: 2050 Total Jobs by TAZ
The SCRP, as discussed in Chapter 4, is also projected to be a catalyst for commercial development and job creation. It is expected to create around 5,000 jobs.
Areas with high residential growth are also projected to foster large commercial centers. An example of this is Polaris Pointe in northern Colorado Springs, near I25 and North Gate Boulevard, where a new music venue, restaurants, and shopping are expected to create a hub of commercial activity in the area.
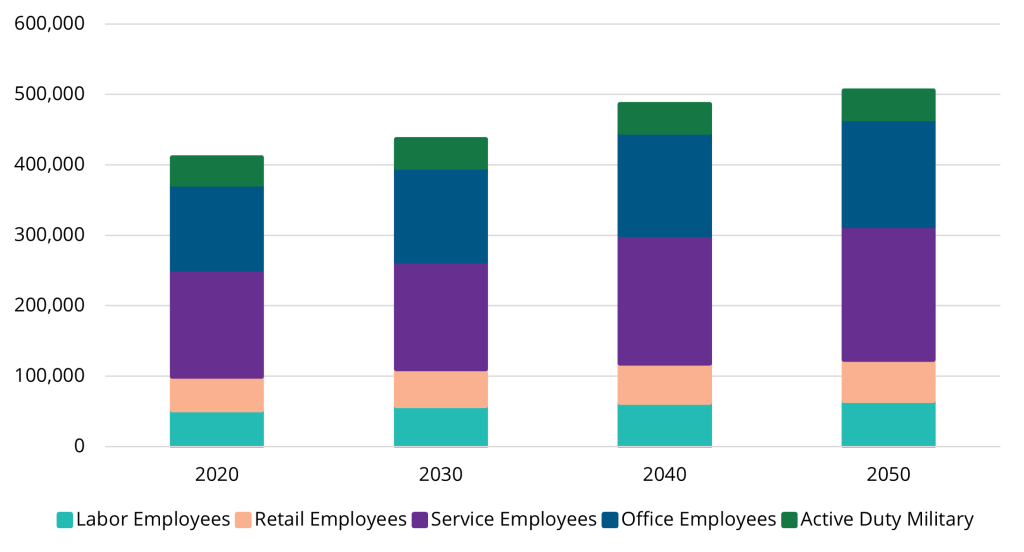
Figure 6-11 shows employment by sector for 2020, 2030, 2040, and 2050. The overall number of jobs is anticipated to increase 23%, from around 412,000 in 2020 to more than 507,000 in 2050. In 2020, service employees accounted for about 37% of jobs, followed by office (29%), labor (13%), retail (11%), and active duty military (9%).
Figure 6-11: Employment by Sector
Transportation and Land Use
Land use and transportation planning are deeply interconnected. Low density development often limits the feasibility of walking, bicycling, transit, and rideshare options. For instance, residential developments located far from activity centers and designed with curvilinear street patterns make it challenging, both physically and financially, to provide effective transit services.
By contrast, developments that integrate transit considerations during planning and construction encourage transit use and improve operational efficiency. Higher density compatible land use supports efficient transit systems and reduces automobile dependency. Similarly, well-connected, high density developments make walking and bicycling more practical and appealing.
Compact, higher density development also shortens trip distances, reducing vehicle miles traveled. This benefits the community by easing traffic congestion, lowering air pollution, and optimizing infrastructure use.
Although land use policies are determined by individual jurisdictions and fall outside PPACG’s authority, collaborative planning can align regional growth with long term transportation goals. This approach promotes sustainable, equitable access to transportation while supporting the region’s overall development vision.
The land use forecast in the 2050 plan reflects many of the recent zoning and development changes that are being adopted throughout the region, but especially important for GHG reduction are the advancements made within the region’s central urban area:
- The City of Colorado Springs recently approved a Unified Development Code (UDC) that encourages, and in some cases even requires, higher density and mixed use development.
- The adopted UDC reduces parking requirements for a number of development types and has several provisions to encourage walkability in new projects.
- A downtown “Form-Based Zone” specifically targets high density development with full parking exemption throughout, and a half a square mile of downtown now has no maximum building height.
- These land use changes are supported by a new downtown circulator, improved bike lanes and roadway lane diets, a robust e-scooter and bike share program, and multiple pedestrian safety improvement projects.
- The Norwood Development Group’s portion of the Banning Lewis Ranch property encompasses over 18,000 acres. Norwood spent 2.5 years to work through a framework plan for the property from 2019 through 2022. These strategies compliment the region’s goal of responsible land use and transportation planning.
- The framework plan anticipates over 77,000 dwelling units and over 22 million square feet of non-residential development creating 69,000 jobs at build out. Three higher density core areas for mixed use development will be linked by Banning Lewis Parkway with a parallel multimodal trail/future transit corridor to create transportation alternatives for future residents.
- Immediate development is being planned and under construction for locations adjacent to existing city areas. This allows the use of existing infrastructure and limits remote housing areas. Each new community will have multiple housing types of varying density to diversify housing offerings and prices.
- A trail and open space plan seeks to place homes within a 5 minute walk to a trailhead/access point. This improves the quality of life of residents and allows trail options to schools, jobs and community hubs.
The Pikes Peak region has made significant progress in adopting land use and development strategies that enhance transportation options for all. The 2050 LRTP shows a marked increase in infill and urban development in its land use forecast compared to the 2045 plan, complementing the transportation changes being implemented by member governments. In addition, the 2050 LRTP includes a diverse mix of multimodal and transit projects which could reduce vehicle dependency. Figures 12, 13, and 14 provide renderings of planned or under construction projects in the Pikes Peak Region.
Figure 6-12: Infill Redevelopment at Chapel Hills Mall

Figure 6-13: Printers Hill Mixed Use Urban Development Near Downtown

Figure 6-14: New 27 Story Mixed Use Project Submitted for Downtown
